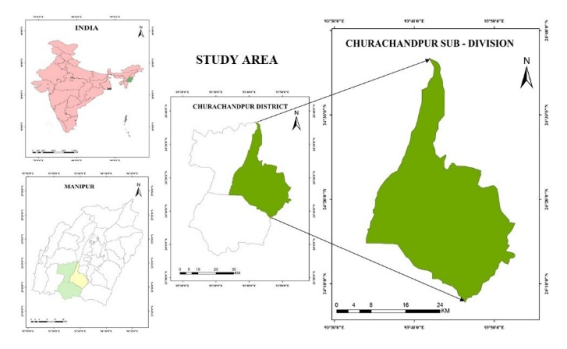
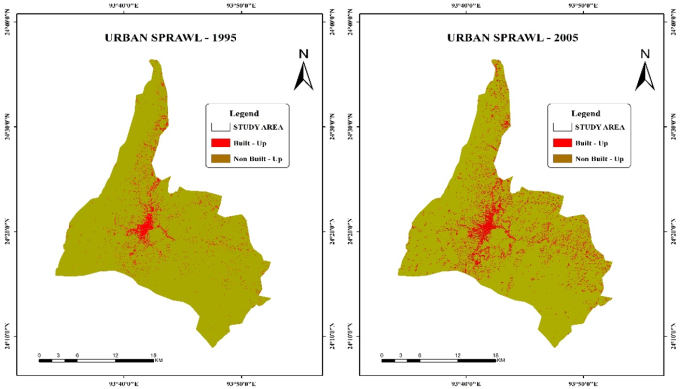
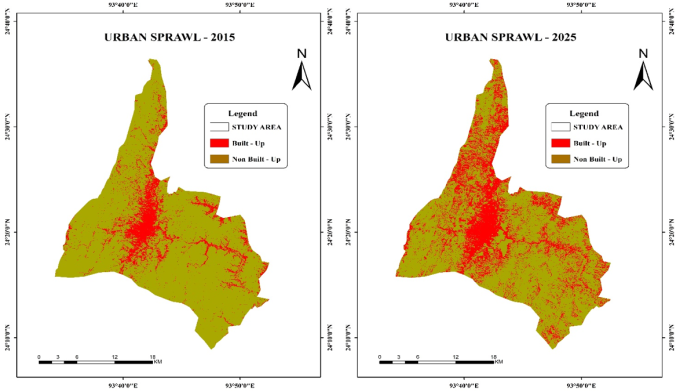
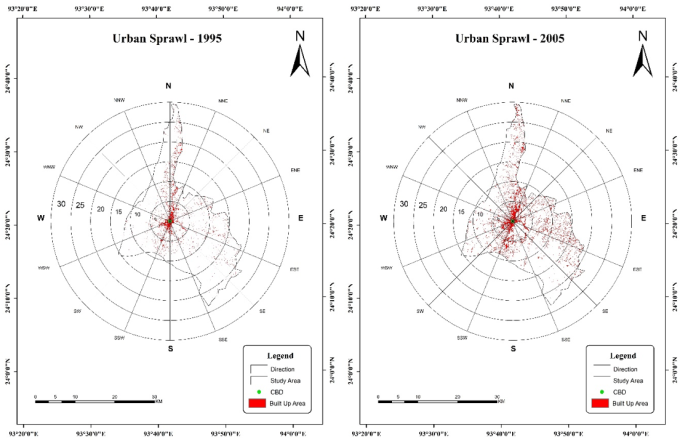
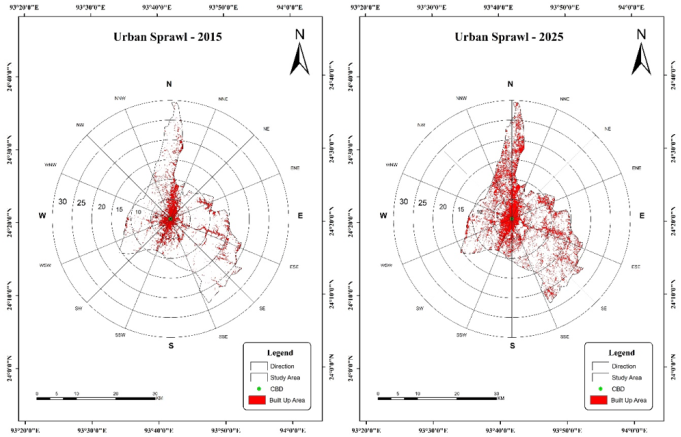
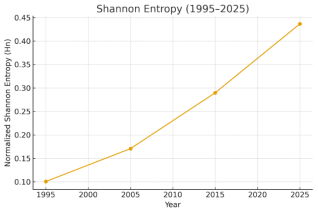
Urban growth and spatial dispersion are important indications of changing land use dynamics, especially in fast growing municipalities. Rapid population growth and unplanned expansion in developing towns have significantly altered land use patterns, necessitating systematic assessment for sustainable planning. This study aims to evaluate the pattern, intensity and spatial characteristics of urban expansion in Lamka town. It employs geospatial techniques and quantitative analysis to provide a reliable understanding of urban transformation and its implications for future development. This study examines the spatio-temporal dynamics of urban growth and spatial dispersion in Lamka town, Manipur, over a 30-year period (1995-2025) using remote sensing and Shannon entropy analysis. Multi-temporal Landsat datasets were classified into built-up and non-built-up categories using the supervised Maximum Likelihood method. The study found that the built-up area increased from 8.5 km2 in 1995 to 58.5 km2 by 2025, whereas non-built-up land decreased. Accuracy assessment demonstrates strong dependability, with overall accuracy above 88% and Kappa values greater than 0.85. Shannon entropy values increased from 0.10 to 0.44, indicating a shift from compact to dispersed urban growth. The entropy graph shows a constant rising trend, with the most rapid growth occurring between 2015 and 2025. This reflects intensified peri-urban expansion and spatial fragmentation. The study exposes the expanding urban sprawl and highlights the urgent need for effective planning strategies and policy interventions to ensure sustainable urban development.
| Published in | American Journal of Remote Sensing (Volume 14, Issue 2) |
| DOI | 10.11648/j.ajrs.20261402.11 |
| Page(s) | 25-33 |
| Creative Commons |
This is an Open Access article, distributed under the terms of the Creative Commons Attribution 4.0 International License (http://creativecommons.org/licenses/by/4.0/), which permits unrestricted use, distribution and reproduction in any medium or format, provided the original work is properly cited. |
| Copyright |
Copyright © The Author(s), 2026. Published by Science Publishing Group |
Urban Growth, Spatial Dispersion, Land Use Land Cover, Entropy Analysis, Geospatial Techniques
Sl. No. | Date of Image | Sensor | Sensors | Resoln. | Band | Band Name | Bandwidth (µm) |
|---|---|---|---|---|---|---|---|
1 | 06-04-1995 | Landsat 5 | Thematic Mapper | 30 | 7 | 1-Blue | 0.45 - 0.52 |
2-Green | 0.52 - 0.60 | ||||||
3-Red | 0.63 - 0.69 | ||||||
4-Near Infrared | 0.77 - 0.90 | ||||||
5-SWIR-1 | 1.55 -1.75 | ||||||
6-Thermal Infrared | 10.40 - 12.50 | ||||||
7-SWIR-2 | 2.09 - 2.35 | ||||||
2 | 22-04-2005 | Landsat 7 | ETM+ | 30 | 8 | 1-Blue | 0.45 - 0.52 |
2-Green | 0.52 - 0.60 | ||||||
3-Red | 0.63 - 0.69 | ||||||
4-NIR | 0.77 - 0.90 | ||||||
5-SWIR 1 | 1.55 - 1.75 | ||||||
6-TIR | 10.40 - 12.50 | ||||||
7-SWIR 2 | 2.09 - 2.35 | ||||||
8-Panchromatic | 0.52 - 0.90 | ||||||
3 | 13-03-2015 | Landsat 8 | OLI | 30 | 9 | 1-Costal/Aerosol | 0.43 - 0.45 |
2-Blue | 0.45 - 0.51 | ||||||
3-Green | 0.53 - 0.59 | ||||||
4-Red | 0.64 - 0.67 | ||||||
5-NIR | 0.85 - 0.88 | ||||||
6-SWIR 1 | 1.57 - 1.65 | ||||||
7-SWIR 2 | 2.11 - 2.29 | ||||||
8-Panchromatic | 0.50 - 0.68 | ||||||
9-Cirrus | 1.36 - 1.38 | ||||||
4 | 05-03-2025 | Landsat 8 | OLI | 30 | 9 | 1-Costal/Aerosol | 0.43 - 0.45 |
2-Blue | 0.45 - 0.51 | ||||||
3-Green | 0.53 - 0.59 | ||||||
4-Red | 0.64 - 0.67 | ||||||
5-NIR | 0.85 - 0.88 | ||||||
6-SWIR 1 | 1.57 - 1.65 | ||||||
7-SWIR 2 | 2.11 - 2.29 | ||||||
8-Panchromatic | 0.50 - 0.68 | ||||||
9-Cirrus | 1.36 - 1.38 |
Sl.No. | Accuracy Assessment | 1995 | 2005 | 2015 | 2025 | 2035 projected |
|---|---|---|---|---|---|---|
1 | Overall Accuracy | 88.5% | 89.8% | 91.2% | 92.5% | 93.5% |
2 | Kappa Coefficient | 86.3% | 87.9% | 89.5% | 91.1% | 92.0% |
Sl.No. | Land Cover Classes | Land cover quantification from 1995 - 2025 | % of Changes from 1995 - 2025 | |||
|---|---|---|---|---|---|---|
1995 | 2005 | 2015 | 2025 | |||
1 | Built - Up (km2) | 8.5 | 16.5 | 33.0 | 58.5 | +50 |
2 | Non Built - Up (km2) | 641.5 | 633.5 | 617.0 | 591.5 | -50 |
Year | Built-up (km²) | Non Built-up (km²) | p (built) | H | Hn (0-1) |
|---|---|---|---|---|---|
1995 | 8.5 | 641.5 | 0.01308 | 0.0697 | 0.1006 |
2005 | 16.5 | 633.5 | 0.02538 | 0.1183 | 0.1707 |
2015 | 33.0 | 617.0 | 0.05077 | 0.2008 | 0.2897 |
2025 | 58.5 | 591.5 | 0.09000 | 0.3025 | 0.4365 |
Year | Built-up (km²) | Non Built-up (km²) | p (built) | p (non-built) | Shannon Entropy H | Normalized Entropy Hn |
|---|---|---|---|---|---|---|
1995 | 8.5 | 641.5 | 0.01308 | 0.98692 | 0.0697 | 0.1006 |
2005 | 16.5 | 633.5 | 0.02538 | 0.97462 | 0.1183 | 0.1707 |
2015 | 33.0 | 617.0 | 0.05077 | 0.94923 | 0.2008 | 0.2897 |
2025 | 58.5 | 591.5 | 0.09000 | 0.91000 | 0.3025 | 0.4365 |
LULC | Land Use Land Cover Change |
TM | Thematic Mapper |
EMT+ | Enhanced Thematic Mapper Plus |
OLI | Operational Land Imager |
GIS | Geographic Information System |
CBD | Central Business District |
| [1] | Barman, S., Roy, D., Chandra Sarkar, B., Almohamad, H., & Abdo, H. G. (2024). Assessment of urban growth in relation to urban sprawl using landscape metrics and Shannon’s entropy model in Jalpaiguri urban agglomeration, West Bengal, India. Geocarto International, 39(1), 2306258. |
| [2] | Basu, T., Das, A., & Pereira, P. (2023). Exploring the drivers of urban expansion in a medium-class urban agglomeration in India using remote sensing techniques and geographically weighted models. Geography and Sustainability, 4(2), 150-160. |
| [3] | Bhattacharjee, J., Acharjee, S., & Mishra, S. (2023). Identification of urban centre and rural growth centres around Guwahati and its surrounding rural region using hierarchical settlements, nested hexagons, remote sensing and GIS. Journal of Geomatics, 17(2), 198-210. |
| [4] | Cho, K. H., Lee, D. H., Kim, T. S., & Jang, G. S. (2021). Measurement of 30-year urban expansion using spatial entropy in Changwon and Gimhae, Korea. Sustainability, 13(2), 632. |
| [5] | Chutia, D., Santra, M., Nishant, N., Singh, P. S., Chouhan, A., & Raju, P. L. N. (2020). Mapping of crime incidences and hotspot analysis through incremental autocorrelation: A case study of Shillong city, Meghalaya, India. Journal of Geomatics, 14(1), 66-76. |
| [6] | Gao, J., & O’Neill, M. (2020). Quantifying urban sprawl: A review of metrics and remote sensing approaches. International Journal of Applied Earth Observation and Geoinformation, 92, 102177. |
| [7] | Haokip, T. L., T. K. Prasad, Jayapal G., and Md. Baharuddin Shah. (2026). Spatio-Temporal Analysis of LULC Change and Its Impacts on Socio-Economic Conditions in Lamka Town, India. Asian Journal of Geographical Research 9 (3):185-95. |
| [8] | Haokip, T. L. and Prasad, T K, A Review on the Role of Geospatial Technology in Resource Analysis and Regional Planning of Churachandpur District, Manipur (January 04, 2025). |
| [9] | Haokip, T. L., SR, S. N., & Prasad, T. K. (2025). Landslide Susceptibility Mapping of Churachandpur District, Manipur, Using Geospatial Techniques. Asian Journal of Geological Research, 8(2), 323-341. |
| [10] | Haokip, T. L. and Gangte, P. Lienzapau and Prasad, T. K. and Haokip, Khaiminlun and Shah, Md. Baharuddin, Integrating Remote Sensing and GIS for Land Use Land Cover Detection and Terrain Evaluation in Churachandpur District, Manipur, India (February 19, 2025) |
| [11] | Haokip, T. L. and Prasad, T. K. and Gangte, P. Lienzapau and Shah, Md. Baharuddin and S, Rajeev and S, Sushama, SOCIO-ENVIRONMENTAL AND DEMOGRAPHIC IMPACTS OF NON-FUNCTIONAL DAM IN NORTH EASTERN STATE OF INDIA: A STUDY ON KHUGA DAM, CHURACHANDPUR, MANIPUR, INDIA. (April 19, 2025).: |
| [12] | Haokip, T. L., Prasad, T. K., Jayapal, G., & Doungel, T. (2025). Integrated FR-WOE and ROC-Validated Landslide Susceptibility Mapping Using Satellite-based Geospatial Data in Pherzawl District, Manipur, India. International Journal of Environment and Climate Change, 15(12), 704-731. |
| [13] | Haokip, T. L., TK, P., Gangte, P. L., & Shah, M. B. (2025). Detection of Ground Water Potential Zone Using GIS Techniques and AHP in Churachandpur Sub-Division, Manipur. |
| [14] | Neog, R. (2025). Decoding urban sprawl in Nagaon, Brahmaputra Valley: A Shannon entropy and Gini coefficient analysis. Environmental Monitoring and Assessment, 197(8), 955. |
| [15] | Nongkynrih, J. M., Pohshna, C., & Sarma, K. K. (2018). Dynamics of shifting cultivation in relation to slope and elevation in parts of Nagaland, India. Current Science, 114(5), 1094-1099. |
| [16] | Taubenböck, H., Wurm, M., & Roth, A. (2016). Remote sensing and metrics for urban form: Measuring dispersion and compactness with multi temporal imagery. Landscape and Urban Planning, 157, 1-10. |
| [17] | Thong, P., Sahoo, U. K., Thangjam, U., & Pebam, R. (2020). Pattern of forest recovery and carbon stock following shifting cultivation in Manipur, North-East India. PLOS ONE, 15(10), e0239906. |
| [18] | Ustaoglu, E., Williams, K., & Filippova, O. (2019). A modified spatial entropy for urban sprawl assessment. Journal of Urban Technology, 26(1), 3-25. |
APA Style
Haokip, T. L., Prasad, T. K., G., J., Gangte, P. L. (2026). Quantitative Analysis of Urban Expansion and Spatial Entropy in Lamka Town, India. American Journal of Remote Sensing, 14(2), 25-33. https://doi.org/10.11648/j.ajrs.20261402.11
ACS Style
Haokip, T. L.; Prasad, T. K.; G., J.; Gangte, P. L. Quantitative Analysis of Urban Expansion and Spatial Entropy in Lamka Town, India. Am. J. Remote Sens. 2026, 14(2), 25-33. doi: 10.11648/j.ajrs.20261402.11
@article{10.11648/j.ajrs.20261402.11,
  author = {T. L. Haokip and T. K. Prasad and Jayapal G. and P. Lienzapau Gangte},
  title = {Quantitative Analysis of Urban Expansion and Spatial Entropy in Lamka Town, India},
  journal = {American Journal of Remote Sensing},
  volume = {14},
  number = {2},
  pages = {25-33},
  doi = {10.11648/j.ajrs.20261402.11},
  url = {https://doi.org/10.11648/j.ajrs.20261402.11},
  eprint = {https://article.sciencepublishinggroup.com/pdf/10.11648.j.ajrs.20261402.11},
  abstract = {Urban growth and spatial dispersion are important indications of changing land use dynamics, especially in fast growing municipalities. Rapid population growth and unplanned expansion in developing towns have significantly altered land use patterns, necessitating systematic assessment for sustainable planning. This study aims to evaluate the pattern, intensity and spatial characteristics of urban expansion in Lamka town. It employs geospatial techniques and quantitative analysis to provide a reliable understanding of urban transformation and its implications for future development. This study examines the spatio-temporal dynamics of urban growth and spatial dispersion in Lamka town, Manipur, over a 30-year period (1995-2025) using remote sensing and Shannon entropy analysis. Multi-temporal Landsat datasets were classified into built-up and non-built-up categories using the supervised Maximum Likelihood method. The study found that the built-up area increased from 8.5 km2 in 1995 to 58.5 km2 by 2025, whereas non-built-up land decreased. Accuracy assessment demonstrates strong dependability, with overall accuracy above 88% and Kappa values greater than 0.85. Shannon entropy values increased from 0.10 to 0.44, indicating a shift from compact to dispersed urban growth. The entropy graph shows a constant rising trend, with the most rapid growth occurring between 2015 and 2025. This reflects intensified peri-urban expansion and spatial fragmentation. The study exposes the expanding urban sprawl and highlights the urgent need for effective planning strategies and policy interventions to ensure sustainable urban development.},
 year = {2026}
}
TY  - JOUR
T1  - Quantitative Analysis of Urban Expansion and Spatial Entropy in Lamka Town, India
AU  - T. L. Haokip
AU  - T. K. Prasad
AU  - Jayapal G.
AU  - P. Lienzapau Gangte
Y1  - 2026/07/03
PY  - 2026
N1  - https://doi.org/10.11648/j.ajrs.20261402.11
DO  - 10.11648/j.ajrs.20261402.11
T2  - American Journal of Remote Sensing
JF  - American Journal of Remote Sensing
JO  - American Journal of Remote Sensing
SP  - 25
EP  - 33
PB  - Science Publishing Group
SN  - 2328-580X
UR  - https://doi.org/10.11648/j.ajrs.20261402.11
AB  - Urban growth and spatial dispersion are important indications of changing land use dynamics, especially in fast growing municipalities. Rapid population growth and unplanned expansion in developing towns have significantly altered land use patterns, necessitating systematic assessment for sustainable planning. This study aims to evaluate the pattern, intensity and spatial characteristics of urban expansion in Lamka town. It employs geospatial techniques and quantitative analysis to provide a reliable understanding of urban transformation and its implications for future development. This study examines the spatio-temporal dynamics of urban growth and spatial dispersion in Lamka town, Manipur, over a 30-year period (1995-2025) using remote sensing and Shannon entropy analysis. Multi-temporal Landsat datasets were classified into built-up and non-built-up categories using the supervised Maximum Likelihood method. The study found that the built-up area increased from 8.5 km2 in 1995 to 58.5 km2 by 2025, whereas non-built-up land decreased. Accuracy assessment demonstrates strong dependability, with overall accuracy above 88% and Kappa values greater than 0.85. Shannon entropy values increased from 0.10 to 0.44, indicating a shift from compact to dispersed urban growth. The entropy graph shows a constant rising trend, with the most rapid growth occurring between 2015 and 2025. This reflects intensified peri-urban expansion and spatial fragmentation. The study exposes the expanding urban sprawl and highlights the urgent need for effective planning strategies and policy interventions to ensure sustainable urban development.
VL  - 14
IS  - 2
ER  -
Department of Geography, Kannur University, Kerala, India
Department of Geography, Kannur University, Kerala, India
Department of Geography, Kannur University, Kerala, India
Department of Geography, Dhanamanjuri University, Manipur, India
Information