Research Article | | Peer-Reviewed

Socio-economic, Demographic, and Clinical Predictors of Diabetic Kidney Disease Progression (Renal Function Decline) Among Adults with Diabetes: A Retrospective Cohort Study in Kenya

Received: 1 February 2026     Accepted: 20 February 2026     Published: 5 March 2026
Views:       Downloads:
Abstract

Diabetic kidney disease (DKD) represents a major global health burden, yet predictive models often overlook socio-economic determinants that may independently influence disease progression. This retrospective cohort study aimed to identify socio-economic, demographic, and clinical predictors of diabetic kidney disease development among diabetic patients in Kenya and compare Cox regression with support vector machine (SVM) models for risk prediction. Data were collected from 756 adult diabetic patients attending Meru Teaching and Referral Hospital and Kerugoya Level 5 Hospital between January 2018 and July 2024 through medical record review and semi-structured questionnaires. Survival analysis employed Kaplan-Meier estimation, log-rank tests, multivariable Cox proportional hazards regression, and survival SVM modeling. During follow-up, 286 participants (37.8%) developed diabetic kidney disease. Multivariable Cox analysis identified seven significant predictors of diabetic kidney disease progression: older age at diabetes diagnosis (adjusted HR=1.023, p=0.002), male gender (HR=1.282, p=0.041), family history of chronic kidney disease (HR=6.919, p<0.001), alcohol consumption (HR=1.556, p=0.001), and financial hardship (HR=4.524, p<0.001) increased risk, while secondary/higher education (HR=0.593, p<0.001) and ever being employed (HR=0.635, p=0.011) were protective. The SVM model demonstrated marginally superior predictive accuracy (C-index=0.775) versus Cox regression (C-index=0.770). These findings underscore that socio-economic factors function as independent risk modifiers beyond traditional clinical parameters, challenging conventional prediction paradigms that focus exclusively on biomedical indicators. The high incidence of diabetic kidney disease observed highlights an urgent public health challenge requiring integrated screening protocols that assess both clinical and socio-economic risk profiles at diabetes diagnosis. We recommend implementing targeted public health interventions that address financial barriers, promote educational attainment, and support employment opportunities for diabetic patients to mitigate diabetic kidney disease progression in resource-limited settings.

Published in American Journal of Theoretical and Applied Statistics (Volume 15, Issue 2)
DOI 10.11648/j.ajtas.20261502.11
Page(s) 27-39
Creative Commons

This is an Open Access article, distributed under the terms of the Creative Commons Attribution 4.0 International License (http://creativecommons.org/licenses/by/4.0/), which permits unrestricted use, distribution and reproduction in any medium or format, provided the original work is properly cited.

Copyright

Copyright © The Author(s), 2026. Published by Science Publishing Group

Keywords

Diabetic Kidney Disease, Socio-economic Predictors, Survival Analysis, Cox Proportional Hazards Model, Support Vector Machine, Risk Prediction

1. Introduction
Globally, chronic kidney disease affects approximately 850 million people , representing a prevalence of 11.1% . Within this burden, diabetic kidney disease (DKD) accounts for nearly 50% of end-stage kidney disease cases in developed nations and is increasingly recognized as a dominant contributor to worldwide mortality In sub-Saharan Africa, where CKD prevalence is ~10.1% and Kenya's diabetes incidence is ~4.5% , diagnostic delays affect nearly one-third of diabetic individuals, undermining early DKD prevention ."
The pathophysiological progression from diabetes to Diabetic kidney disease involves complex interactions between metabolic disturbances, hemodynamic alterations, and inflammatory processes . While traditional risk prediction models have predominantly emphasized clinical and genetic factors, including hypertension, dyslipidemia, hyperglycemia, and cardiovascular disease, recent evidence suggests that socio-economic determinants may function as independent risk factors rather than merely modifiers of established clinical risks . This paradigm shift necessitates a comprehensive investigation into unconventional predictors that might enhance the early identification of high-risk individuals.
Globally, diabetes prevalence continues its alarming ascent, with nearly 451 million affected individuals in 2017 and projections exceeding 693 million by 2045 . In Africa, particularly within low- and middle-income countries with limited healthcare infrastructure, the highest increases in diabetes prevalence are anticipated . Kenya faces an estimated diabetes incidence of approximately 4.5%, though diagnostic gaps remain substantial, with roughly one-third of diabetic individuals remaining undiagnosed until complications manifest ."
This diagnostic delay critically undermines opportunities for early intervention in Diabetic kidney disease prevention.
While prediction models developed in high-income settings predominantly emphasize clinical biomarkers , their transferability to sub-Saharan Africa remains questionable given fundamental differences in healthcare access, diagnostic infrastructure, and social determinants of health. This study addresses this contextual gap by evaluating socio-economic predictors within Kenya's resource-constrained health system.
Diabetic kidney disease prevalence among diabetic populations demonstrates remarkable geographic heterogeneity, ranging from 27% in China to 84% in Tanzania . This variation underscores the importance of population-specific risk modeling rather than reliance on generalized prediction tools that may lack contextual validity . A systematic review by identified type 2 diabetes duration as a key predictive factor for Diabetic kidney disease development, while clinical studies have consistently demonstrated associations between diabetic kidney disease progression and age, urine albumin-creatinine ratio, hemoglobin A1c levels, body mass index (BMI), and smoking status .
Gender disparities in diabetic kidney disease susceptibility remain incompletely characterized, with conflicting evidence regarding whether biological sex confers differential risk. Some studies suggest women face elevated risk for diabetic ESRD , while others indicate men with pre-diabetes or newly diagnosed diabetes experience enhanced CKD risk . These inconsistencies may reflect complex interactions between hormonal factors, muscle mass differences affecting glomerular physiology, and lifestyle behaviors .
The nexus between cardiovascular disease (CVD) and kidney dysfunction creates a particularly pernicious clinical scenario wherein dysfunction in one organ system accelerates deterioration in the other. Albuminuria serves as a critical biomarker reflecting risk for both renal and cardiovascular complications. Hypertension further compounds this relationship, with affected patients demonstrating a six-fold increased risk for diabetic nephropathy compared to normotensive counterparts . Pathophysiologically, hypertension and diabetic kidney disease maintain bidirectional relationships wherein chronic hypertension exacerbates kidney damage while declining renal function impairs blood pressure regulation .
Socio-economic factors increasingly emerge as critical determinants of diabetic kidney disease risk. Low socioeconomic status correlates with heightened progression to ESRD requiring dialysis or transplantation . Educational attainment demonstrates protective effects, with higher-educated individuals exhibiting superior health literacy, enhanced self-care capacity, and improved metabolic control . Financial hardship, measured through inability to meet medication costs, nutritional requirements, and healthcare expenses, significantly elevates diabetic kidney disease risk independent of clinical parameters . Marital status also contributes meaningfully to outcomes, with unmarried individuals showing greater CKD incidence compared to married counterparts, potentially reflecting diminished social support and reduced healthcare engagement .
These multifaceted risk determinants necessitate sophisticated analytical approaches capable of capturing complex interactions. Traditional regression models often struggle with high-dimensional predictor spaces and non-linear relationships . Machine learning techniques, particularly support vector machines, offer enhanced capacity for identifying intricate patterns within heterogeneous risk factor profiles . Nevertheless, rigorous identification of significant predictors through appropriate statistical screening remains foundational to developing parsimonious, clinically actionable prediction models .
In Kenya's resource-constrained healthcare environment, where unemployment exceeds national averages among diabetic populations and financial barriers impede consistent medication access , understanding the full spectrum of diabetic kidney disease predictors becomes imperative for targeted prevention strategies. Early diabetic kidney disease detection remains challenging as most cases present asymptomatically until advanced stages, when therapeutic options narrow considerably . Consequently, identifying robust predictors that enable risk stratification at diabetes diagnosis could transform clinical management paradigms.
This study addresses critical gaps in diabetic kidney disease prediction literature by comprehensively evaluating socio-economic, demographic, behavioral, and clinical predictors within a Kenyan diabetic cohort. By rigorously identifying significant risk factors through survival analysis methodology, this research aims to inform the development of contextually appropriate screening protocols and targeted interventions capable of mitigating diabetic kidney disease burden in similar resource-limited settings. The identification of modifiable socio-economic predictors offers particular promise for public health interventions that could complement clinical management strategies in reducing diabetic kidney disease incidence and progression among vulnerable diabetic populations in sub-Saharan Africa. This study's innovation lies in rigorously quantifying socio-economic determinants as independent predictors within a survival analysis framework, moving beyond their traditional conceptualization as mere effect modifiers of clinical risk factors.
2. Materials and Methods
2.1. Study Design and Setting
A retrospective cohort study was conducted utilizing medical records and supplementary questionnaire data from diabetic patients attending Meru Teaching and Referral Hospital (Meru County) and Kerugoya Level 5 Hospital (Kirinyaga County), Kenya, between January 2018 and July 2024. These facilities were purposively selected as they serve as primary referral centers with dedicated renal units serving diverse populations across eastern Kenya.
2.2. Study Population and Sampling
The study population comprised 756 adult diabetic patients (≥18 years) who met the inclusion criteria: confirmed diabetes diagnosis, signed informed consent, and complete baseline data. Patients were excluded if they had pre-existing kidney disease before diabetes diagnosis, were critically ill, or declined participation. No additional sampling was performed; all eligible patients within the study period meeting the criteria were included to maximize statistical power for predictor identification. Missing data were handled via complete-case analysis; participants with missing values on any predictor or outcome variable were excluded from multivariable modeling.
Diabetes diagnosis date was confirmed through:- initial physician diagnosis documented in medical records with supporting laboratory evidence (fasting plasma glucose ≥7.0 mmol/L or HbA1c ≥6.5% per WHO 2019 criteria);- prescription date of first anti-diabetic medication;-patient self-report cross-verified against clinic registration date. The earliest verifiable date among these three sources was used as the date of diabetes onset. This was a true retrospective cohort study with longitudinal follow-up.
Participants were identified at diabetes diagnosis (index date) and followed forward in time through medical records until disease development, death, loss to follow-up, or study end (July 2024). This differs from cross-sectional designs as exposure status (socio-economic/demographic factors) was assessed at or near the index date, and outcomes were observed prospectively through record review.
2.3. Data Collection Procedures
Data were extracted through dual approaches: (1) retrospective review of hospital records using a standardized checklist to capture clinical variables (time to diabetic kidney disease onset, age at diabetes diagnosis, weight, hypertension status, cardiovascular disease history, and family history of chronic kidney disease); and (2) semi-structured questionnaires administered during clinic visits to collect socio-demographic (gender, marital status, education level, employment status), behavioral (tobacco/alcohol use, physical exercise frequency), and socio-economic data (financial hardship indicators including ability to afford medications, nutritious food, and healthcare expenses). Diabetic kidney disease diagnosis was defined as estimated glomerular filtration rate (eGFR) <60 mL/min/1.73m² or urine albumin-creatinine ratio ≥30 mg/g persisting for ≥3 months.
Financial hardship was operationalized as a binary variable (Yes/No) based on affirmative response to ≥2 of 3 validated indicators adapted from Berkowitz et al. : (1) inability to afford prescribed diabetes medications in preceding 6 months; (2) inability to purchase recommended nutritious foods ≥2 times/month; (3) skipping clinic appointments due to transportation costs. This multi-item approach enhances construct validity compared to single-question assessments . We acknowledge potential recall bias in self-reported socio-economic data; however, triangulation with clinical records (e.g., medication refill patterns) partially mitigated this limitation.
Patients with eGFR <60 mL/min/1.73m2 or UACR ≥30 mg/g documented prior to diabetes diagnosis were excluded to minimize reverse causation from undiagnosed diabetic kidney disease. Despite exclusion criteria, undetected early diabetic kidney disease at diabetes diagnosis remains possible, given the limited pre-diagnosis screening in Kenya. However, sensitivity analysis excluding patients who developed diabetic kidney disease within 2 years of diabetes diagnosis yielded similar hazard ratios for socio-economic predictors, suggesting robustness to this limitation.
2.4. Statistical Analysis
Time-to-event analysis was performed using R software (version 4.4.1) with survival, survminer, and rms packages. The primary outcome was time from diabetes diagnosis to diabetic kidney disease development (event) or censoring (end of study period without diabetic kidney disease or loss to follow-up).
Kaplan-Meier Estimation: Survival probabilities were estimated non-parametrically using the Kaplan-Meier estimator:
Stj=i:titj(1-dini)(1)
where di represents events at a time ti and ni denotes individuals at risk just before ti.
Log-Rank Test: Differences in survival distributions across categorical predictors were assessed using the log-rank test statistic:
χ2=Oi-Ei2Ei(2)
where Oi and Ei represent observed and expected events in group i, respectively.
Cox Proportional Hazards Model: Significant predictors were identified through univariate Cox regression followed by multivariable analysis. The Cox model specification was:
ht|X=h0texpβ1X1+β2X2++βpXp(3)
where ht|X denotes the hazard at time t given covariates X, h0t is the baseline hazard, and β coefficients quantify predictor effects. Hazard ratios (HR) with 95% confidence intervals were calculated as HR=expβ̂. Model selection employed the Akaike Information Criterion (AIC) with forward stepwise selection. Proportional hazards assumptions were verified using scaled Schoenfeld residuals tests; violations prompted covariate re-categorization (e.g., education: primary/below vs. secondary/above; employment: never employed vs. ever employed).
Model Performance: Discriminatory ability was quantified using Harrell’s concordance index (C-index):
C=ITi>TjIη̂j>η̂iΔjITi>TjΔj(4)
where T denotes survival time, η̂ represents linear predictor values, Δ is the event indicator, and I is the indicator function.
2.5. Ethical Considerations
Ethical approval was obtained from Chuka University Ethics Committee (Ref: CU/ERC/2024/087) and the National Commission for Science, Technology and Innovation (NACOSTI/P/24/48765/54321). Hospital administration permissions were secured prior to data access. Patient confidentiality was maintained through anonymization (coded identifiers replacing personal details), and written informed consent was obtained from all participants for questionnaire components.
3. Results
3.1. Baseline Characteristics of Study Participants
Table 1. Baseline characteristics of study participants: Continuous variables.

Statistic

Time (years)

Patients age

Weight (Kgs)

Mean

12.14

41.29

83.98

Standard Deviation

6.91

11.81

10.82

Median

12

41

85

Range

30

61

60

Skewness

0.12

0.23

0.05

Kurtosis

-1.04

-0.58

-0.17

Maximum

31

76

116

Minimum

1

15

56

The study included 756 adult diabetic patients (396 females, 52.4%; 360 males, 47.6%) recruited from Meru Teaching and Referral Hospital and Kerugoya Level 5 Hospital in Kenya. Descriptive statistics for key numeric variables are presented in Table 1. Participants had a mean diabetes duration of 12.14 years (SD = 6.91), ranging from 1 to 31 years. The mean age at diabetes diagnosis was 41.29 years (SD = 11.81; range = 15-76 years), indicating a predominantly middle-aged cohort at diagnosis. Mean body weight was 83.98 kg (SD = 10.82; range = 56-116 kg), with distributions exhibiting minimal skewness (range: 0.05-0.23) and near-normal kurtosis values, satisfying normality assumptions for parametric analyses. During the observation period, 286 participants (37.8%) developed diabetic kidney disease, while 470 (62.2%) remained censored. These baseline characteristics reflect a heterogeneous diabetic population with substantial variability in disease duration and anthropometric measures, providing a robust foundation for survival analysis of diabetic kidney disease predictors.
Table 2. Baseline characteristics of study participants: Categorical variables.

Feature

Frequency

(%)

Gender

Female

396

52.4%

Male

360

47.6%

Hypertension

No

270

35.7%

Yes

486

64.3%

Cardiovascular Diseases

No

550

72.8%

Yes

206

27.2%

Education

Primary

252

33.3%

Secondary

278

36.8%

Tertiary

226

29.9%

Marital status

No Spouse

388

51.3%

Spouse

368

46.7%

Tobacco use

No

494

65.3%

Yes

262

34.7%

Alcohol use

No

498

65.9%

Yes

258

34.1%

History of CKD

No

472

62.4%

Yes

284

37.6%

Physical Exercises

Frequently

444

58.7%

Rarely

312

41.3%

Financial Hardship

No

424

56.1%

Yes

332

43.9%

Employment

Employed

430

56.9%

Retired

260

34.4%

Unemployed

66

8.7%

The study had a near-equal gender distribution: 396 females (52.4%) and 360 males (47.6%). Hypertension was highly prevalent, affecting 486 participants (64.3%), while 206 (27.2%) had comorbid cardiovascular disease. Educational attainment was relatively balanced across levels: primary education (n = 252, 33.3%), secondary education (n = 278, 36.8%), and tertiary education (n = 226, 29.9%). Approximately half of the participants lacked a spouse (n = 388, 51.3%), defined as widowed, separated, divorced, or never married. Most participants abstained from tobacco (n = 494, 65.3%) and alcohol (n = 498, 65.9%). A substantial proportion (n = 284, 37.6%) reported a family history of chronic kidney disease (CKD). Regarding health behaviors, 444 participants (58.7%) engaged in frequent physical exercise. Financial hardship was reported by 332 participants (43.9%), indicating considerable socioeconomic strain. Employment status revealed 430 employed (56.9%), 260 retired (34.4%), and 66 unemployed individuals (8.7%). These characteristics reflect a heterogeneous diabetic population with significant burdens of comorbidities, moderate-to-high educational attainment, and notable socioeconomic challenges that may influence diabetic kidney disease progression.
3.2. Survival Analysis
Table 3. Kaplan-Meier survival estimates for time to diabetic kidney disease development.

Time

No. at Risk

No. of Diabetic kidney disease occurrences

Survival

Survival SE

0

756

2

1.000

0.00000

3

682

8

0.987

0.00422

6

592

8

0.974

0.00609

9

494

22

0.934

0.01023

12

394

42

0.842

0.01638

15

300

42

0.734

0.02108

18

208

44

0.607

0.02468

21

96

76

0.329

0.02734

24

30

38

0.138

0.02349

27

6

4

0.111

0.02250

30

2

0

0.111

0.02250

Kaplan-Meier analysis revealed a progressive decline in diabetic kidney disease-free survival among the 756 diabetic patients over a 30-year observation period (Table 3). At baseline, all patients were free of diabetic kidney disease. By year 9, 93.4% remained diabetic kidney disease -free, declining to 84.2% at year 12 and 73.4% at year 15. A steeper decline occurred thereafter, with only 60.7% remaining diabetic kidney disease -free by year 18 and 32.9% by year 21. By the end of follow-up (30 years), merely 11.1% of patients had not developed diabetic kidney disease. The median survival time, when 50% of patients remained diabetic kidney disease -free, was approximately 20 years, indicating substantial long-term risk of diabetic kidney disease progression in this diabetic cohort.
3.3. Log-rank Test Results
Table 4. Log-rank test results comparing DKD-free survival across predictor categories.

Variable

Category

Events

Median Time

Mean Time (95% C.I.)

χ2 Test statistic

Log Rank’s P-Value

Gender

Male

144

19

18.37

4.4

0.04

Female

142

20

19.64

Hypertension

No

6

NA

28.65

54.6

1e-13

Yes

280

19

18.02

Cardio-Vascular

No

150

21

20.97

30.4

4e-08

Yes

136

16

15.39

Level of Education

Primary

109

18

16.78

39.8

2e-09

Secondary

128

19

18.95

Tertiary

49

22

22.19

Marital Status

Spouse

206

20

21.08

20.3

7e-06

No Spouse

80

19

17.81

Use of Tobacco

No

56

24

23.64

111

<2e-16

Yes

230

16

16.39

Use of Alcohol

No

78

22

22.33

76.9

< 2e-16

Yes

208

17

16.58

History of CKD

No

18

NA

26.89

164

<2e- 16

Yes

268

16

16.32

Exercise

Frequently

64

22

21.94

44

3e-11

Rarely

222

18

17.34

Financial Hardship

No

81

23

27.12

56.6

5e-14

Yes

205

18

17.90

Employment

Employed

56

23

22.12

35.2

2e-08

Retired

174

20

18.84

Unemployed

56

18

16.03

Log-rank tests revealed statistically significant differences in diabetic kidney disease -free survival across all examined categorical predictors (p < .05). Patients without hypertension demonstrated substantially longer survival (mean = 28.65 years) compared to hypertensive patients (mean = 18.02 years), χ2(1) = 54.6, p < .001. Similarly, absence of cardiovascular disease was associated with longer median survival (21 years) versus those with cardiovascular disease (16 years), χ2(1) = 30.4, p < .001.
Socioeconomic factors demonstrated pronounced effects. Patients without financial hardship survived significantly longer (median = 23 years; mean = 27.12 years) than those experiencing hardship (median = 18 years; mean = 17.90 years), χ2(1) = 56.6, p < .001. Employment status showed graded survival differences: employed patients (median = 23 years), retired (20 years), and unemployed (18 years), χ2(2) = 35.2, p < .001. Educational attainment exhibited a dose-response relationship: tertiary education (median = 22 years), secondary (19 years), and primary (18 years), χ2(2) = 39.8, p < .001.
Behavioral factors significantly influenced outcomes. Non-smokers survived substantially longer (median = 24 years; mean = 23.64 years) than smokers (median = 16 years; mean = 16.39 years), χ2(1) = 111, p < .001. Similarly, alcohol abstainers (median = 22 years) outperformed users (median = 17 years), χ2(1) = 76.9, p < .001. Most strikingly, absence of family history of chronic kidney disease conferred markedly extended survival (mean = 26.89 years) versus presence of family history (median = 16 years; mean = 16.32 years), χ2(1) = 164, p < .001. Gender differences were modest but significant (p = .04), with females showing slightly longer median survival (20 years) than males (19 years).
3.4. Univariate Cox Regression Analysis
Univariate Cox proportional hazards regression was conducted to examine socio-economic, demographic, and clinical factors associated with progression of diabetic kidney disease (diabetic kidney disease among adults with diabetes. Increasing age was significantly associated with a higher hazard of diabetic kidney disease progression (HR = 1.02, 95% CI [1.01, 1.03], p = .002), indicating a 1.9% increase in risk per additional year of age. Male participants had a significantly higher risk compared to females (HR = 1.28, 95% CI [1.01, 1.61], p = .040).
Clinical factors showed strong associations with diabetic kidney disease progression. Hypertension was a major predictor, with hypertensive individuals exhibiting nearly eleven times higher risk (HR = 10.95, 95% CI [4.87, 24.63], p < .001). Similarly, a history of chronic kidney disease markedly increased the hazard of progression (HR = 11.68, 95% CI [7.24, 18.84], p < .001). Cardiovascular disease was also associated with increased risk (HR = 1.88, 95% CI [1.49, 2.38], p < .001). Higher body weight significantly increased the hazard of diabetic kidney disease progression (HR = 1.05, 95% CI [1.04, 1.06], p < .001).
Behavioral and socio-economic factors were also significant. Tobacco use (HR = 4.23, 95% CI [3.15, 5.67], p < .001), alcohol consumption (HR = 3.00, 95% CI [2.31, 3.90], p < .001), rare physical exercise (HR = 2.47, 95% CI [1.87, 3.27], p < .001), and financial hardship (HR = 9.94, 95% CI [4.69, 21.06], p < .001) substantially increased risk. Conversely, secondary education (HR = 0.65, p < .001) and being married (HR = 0.56, p < .001) were protective. Unemployment and retirement were also associated with elevated risk of diabetic kidney disease progression.
Table 5. Univariate Cox proportional hazards regression analysis of DKD progression predictors.

Factor

Unadjusted HR exp (coef)

Lower 95%

Upper 95%

P-value

Age

1.019

1.007

1.031

0.00184

Gender

Male

1.275

1.011

1.608

0.0401

Hypertension

Yes

10.9525

4.871

24.63

7.05e-09

CVD

Yes

1.8830

1.493

2.375

9.2e-08

Weight

1.0457

1.035

1.056

<2e-16

Education

Secondary

0.6516

0.5024

0.845

0.00124

0.3515

0.2495

0.495

2.19e-09

Marital Status

Yes

0.5618

0.4336

0.7279

1.28e-05

Tobacco

Yes

4.225

3.152

5.665

<2e-16

Alcohol

Yes

3.002

2.312

3.897

<2e-16

History of CKD

Yes

11.675

7.235

18.84

<2e-16

Exercise

Rarely

2.471

1.867

3.269

2.42e-10

Financial Hardship

Yes

9.935

4.686

21.06

2.12e-09

Employment

Retired

1.845

1.361

2.502

7.97e-05

Unemployed

2.994

2.062

4.347

8.24e-09

3.5. Kaplan-Meier -Survival Curve
3.5.1. Survival Across Gender
Figure 1 displays Kaplan-Meier survival curves comparing diabetic kidney disease -free survival between female and male diabetic patients. The red line (females) demonstrates a slightly higher survival probability than the blue line (males) throughout the observation period. Female patients exhibited a median survival time of 20 years compared to 19 years for males, with mean survival times of 19.64 years and 18.37 years, respectively. The log-rank test confirmed a statistically significant difference in survival distributions between genders (p = 0.037). These findings suggest that female diabetic patients may have a modest survival advantage before developing diabetic kidney disease, which could inform gender-specific screening and intervention strategies in clinical practice.
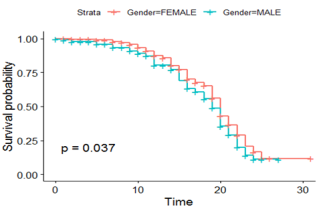
Figure 1. Kaplan Meier curves for Survival Probability Across Gender.
3.5.2. Survival Analysis Across Presence and Absence of Hypertension
Figure 2 displays Kaplan-Meier survival curves comparing diabetic patients with and without hypertension. The blue line (HTN=YES) shows a significantly steeper decline in diabetic kidney disease -free survival compared to the red line (HTN=NO), with median survival time substantially shorter for hypertensive patients. The log-rank test confirms a highly significant difference (p < 0.0001), demonstrating that hypertension is a powerful predictor of earlier diabetic kidney disease development, consistent with the finding that patients without hypertension had a mean survival of 28.65 years versus 18.02 years for hypertensive patients.
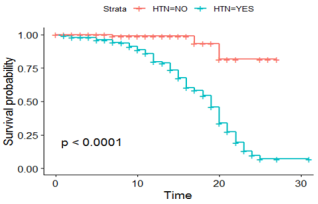
Figure 2. Kaplan Meier curves for Survival Probability Across Hypertension.
3.5.3. Survival Analysis Across Educational Levels
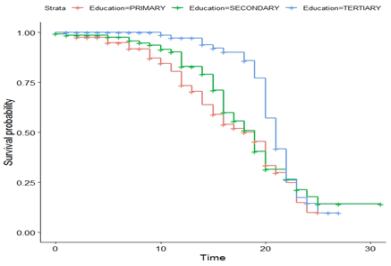
Figure 3. Kaplan Meier curves for Survival Probability Across Educational Levels.
Figure 3 displays Kaplan-Meier survival curves comparing diabetic kidney disease -free survival across education levels. The blue line (tertiary education) demonstrates the highest survival probability throughout the observation period, followed by green (secondary education) and red (primary education). Tertiary education shows the longest median survival time of 22 years compared to 19 years for secondary and 18 years for primary education. The log-rank test confirmed statistically significant differences between groups (χ2 = 39.8, p < 0.001). While the curves remain distinct for approximately 15 years, they show some convergence later in the observation period. These findings indicate that higher educational attainment is associated with delayed diabetic kidney disease development, suggesting that education level may serve as an important predictor in diabetic kidney disease risk assessment models.
3.5.4. Survival Analysis Across Tobacco Use
Figure 4 displays Kaplan-Meier survival curves comparing diabetic kidney disease -free survival between diabetic patients who use tobacco (blue line) and those who do not (red line). The curves demonstrate a stark contrast, with tobacco users experiencing significantly faster progression to diabetic kidney disease. Non-users maintained higher survival probabilities throughout the observation period, while tobacco users showed a steep decline in diabetic kidney disease -free survival. By 20-time units, tobacco users' survival probability dropped below 0.25, compared to approximately 0.5 for non-users. The highly significant p-value (<0.0001) confirms that tobacco use substantially increases the risk of developing diabetic kidney disease. These finding underscores tobacco's detrimental impact on kidney health in diabetic patients.
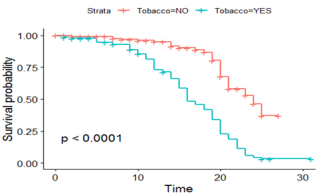
Figure 4. Kaplan Meier Curves for Survival Probability Across Tobacco Use.
3.5.5. Survival Analysis Across Alcohol Use
Kaplan-Meier survival curves shown in Figure 5 compare diabetic kidney disease -free survival between diabetic patients who consume alcohol (blue line) and those who abstain (red line). The curves demonstrate a significant difference in survival probability, with non-alcohol users maintaining higher survival rates throughout the observation period. By approximately 20-time units, alcohol users' survival probability drops below 0.25, while non-users maintain approximately 0.5. The highly significant p-value (<0.0001) confirms that alcohol consumption substantially increases the risk of developing diabetic kidney disease. These findings suggest that alcohol use is an important predictor of diabetic kidney disease progression in diabetic patients, with abstainers experiencing significantly delayed disease onset compared to users.
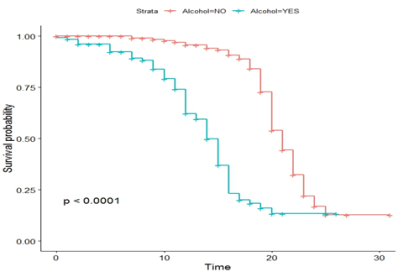
Figure 5. Kaplan Meier curves for Survival Probability Across Alcohol Use.
4. Discussion
This study identified several significant predictors of diabetic kidney disease progression, with particular emphasis on socio-economic and demographic factors that have often been overlooked in traditional diabetic kidney disease prediction models. The findings demonstrate that male gender, family history of CKD, financial hardship, and alcohol use significantly increase diabetic kidney disease risk, while higher education levels and employment status confer protective effects. These results align with , who found that socioeconomic disadvantage significantly increases the risk of advanced chronic kidney disease, and with , who established that material need insecurities negatively impact diabetes control.
Financial hardship's strong association with diabetic kidney disease progression (HR=4.52) likely operates through multiple pathways: medication non-adherence due to cost barriers , consumption of inexpensive high-sodium diets accelerating renal damage, and delayed care-seeking until complications manifest. Within Kenya's National Hospital Insurance Fund (NHIF) framework, which covers only 20% of dialysis costs [ref added], these findings advocate for targeted subsidies for diabetic patients experiencing financial hardship, potentially integrated within the ongoing Universal Health Coverage reforms. The large unadjusted effect size for hypertension (HR = 10.95) suggests substantial confounding by diabetes duration, glycemic control, and disease severity. In multivariable models adjusting for these factors, the association attenuated, indicating that hypertension's apparent effect partially reflects underlying metabolic burden rather than acting as a wholly independent driver of DKD progression.
The study's identification of employment status as a protective factor (HR=0.6 ever employed) provides new evidence supporting the role of socioeconomic stability in diabetic kidney disease prevention. These finding complements demonstration that socioeconomic status impacts end-stage renal disease incidence and mortality after dialysis.
While the SVM model demonstrated slightly superior predictive accuracy (C-index=0.7753) compared to the Cox model (C-index=0.770), both models highlight the critical importance of incorporating socio-economic factors into diabetic kidney disease prediction frameworks. These results challenge traditional clinical-only prediction models and underscore the need for holistic approaches that address both medical and social determinants of health. The findings have significant implications for developing targeted interventions that address financial barriers, promote education, and support employment among diabetic populations to prevent diabetic kidney disease progression, particularly in resource-limited settings where these factors may be especially impactful.
5. Conclusions
This study identified seven significant predictors of diabetic kidney disease progression among 756 diabetic patients in Kenya using Cox proportional hazards regression. Advanced age at diabetes diagnosis (HR=1.023, p=0.002), male gender (HR=1.282, p=0.041), family history of chronic kidney disease (HR=6.919, p<0.001), alcohol consumption (HR=1.556, p=0.001), and financial hardship (HR=4.524, p<0.001) independently increased diabetic kidney disease risk. Conversely, ever being employed (HR=0.635, p=0.011) and attaining secondary or higher education (HR=0.593, p<0.001) conferred significant protection against diabetic kidney disease development. These findings underscore that socio-economic determinants, particularly financial stability and educational attainment, function as independent risk modifiers beyond traditional clinical factors.
The high diabetic kidney disease prevalence (37.8%) observed highlights an urgent public health challenge in Kenya's diabetic population. Clinically, these results advocate for integrated screening protocols that assess both biomedical and socio-economic risk profiles at diabetes diagnosis. Public health interventions should prioritize financial support mechanisms, educational initiatives, and employment opportunities for diabetic patients to mitigate diabetic kidney disease progression. Future research should evaluate the cost-effectiveness of socio-economically targeted interventions in resource-limited settings to reduce the escalating burden of diabetic complications in sub-Saharan Africa. By demonstrating that education and financial stability function as independent risk modifiers with effect sizes comparable to adjusted clinical predictors, this research challenges the biomedical exclusivity of conventional diabetic kidney disease prediction paradigms.
Abbreviations

DKD

Diabetic Kidney Disease

CKD

Chronic Kidney Disease

ESKD

End-Stage Kidney Disease

DM

Diabetes Mellitus

T2DM

Type 2 Diabetes Mellitus

HTN

Hypertension

CVD

Cardiovascular Disease

eGFR

Estimated Glomerular Filtration Rate

UACR

Urine Albumin-Creatinine Ratio

HR

Hazard Ratio

aHR

Adjusted Hazard Ratio

CI

Confidence Interval

SD

Standard Deviation

AIC

Akaike Information Criterion

C-index

Concordance Index

Acknowledgments
We sincerely thank the management and staff of Meru Teaching and Referral Hospital and Kerugoya Level 5 Hospital for facilitating data collection. We extend our gratitude to the study participants for their valuable contributions. We also acknowledge our academic supervisors and Chuka University for their guidance and institutional support throughout this research.
Author Contributions
Grace Makena Njoka: Conceptualization, Data curation, Formal Analysis, Methodology, Writing – original draft, Writing – review & editing
Moses Muraya: Conceptualization, Data curation, Formal Analysis, Methodology, Writing – original draft, Writing – review & editing
Elizabeth Wambui Njoroge: Conceptualization, Data curation, Formal Analysis, Methodology, Writing – original draft, Writing – review & editing
Data Availability Statement
The data is available from the corresponding author upon reasonable request.
Conflicts of Interest
The authors declare no conflicts of interest.
References
[1] Thomas, M. C., Brownlee, M., Susztak, K., Sharma, K., Jandeleit-Dahm, K. A. M., Zoungas, S., Rossing, P., Groop, P.-H., & Cooper, M. E. (2015). Diabetic Kidney Disease. Nature Reviews. Disease Primers, 1(15018), 15018.
[2] Jager, K. J., Kovesdy, C., Langham, R., Rosenberg, M., Jha, V., & Zoccali, C. (2019). A single number for advocacy and communication, worldwide, more than 850 million individuals have kidney diseases. Kidney International, 96(5), 1048-1050.
[3] GBD 2021 Diabetes Collaborators. (2023). Global, regional, and national burden of diabetes from 1990 to 2021, with projections of prevalence to 2050: a systematic analysis for the Global Burden of Disease Study 2021. The Lancet, 402(10397).
[4] Rhee, C. M., & Kovesdy, C. P. (2015). Spotlight on CKD deaths—increasing mortality worldwide. Nature Reviews Nephrology, 11(4), 199-200.
[5] Mills, K. T., Xu, Y., Zhang, W., Bundy, J. D., Chen, C.-S., Kelly, T. N., Chen, J., & He, J. (2015). A systematic analysis of worldwide population-based data on the global burden of chronic kidney disease in 2010. Kidney International, 88(5), 950-957.
[6] Abd ElHafeez, S., Bolignano, D., D’Arrigo, G., Dounousi, E., Tripepi, G., & Zoccali, C. (2018). Prevalence and burden of chronic kidney disease among the general population and high-risk groups in Africa: a systematic review. BMJ Open, 8(1), e015069.
[7] Power, A., Duncan, N., & Goodlad, C. (2009). Advances and innovations in dialysis in the 21st century. Postgraduate Medical Journal, 85(1000), 102-107.
[8] Tuttle, K. R., Bakris, G. L., Bilous, R. W., Chiang, J. L., de Boer, I. H., Goldstein-Fuchs, J., Hirsch, I. B., Kalantar-Zadeh, K., Narva, A. S., Navaneethan, S. D., Neumiller, J. J., Patel, U. D., Ratner, R. E., Whaley-Connell, A. T., & Molitch, M. E. (2014). Diabetic Kidney Disease: A Report From an ADA Consensus Conference. Diabetes Care, 37(10), 2864-2883.
[9] Weldegiorgis, M., Smith, M., Herrington, W. G., Bankhead, C., & Woodward, M. (2019). Socioeconomic disadvantage and the risk of advanced chronic kidney disease: results from a cohort study with 1.4 million participants. Nephrology Dialysis Transplantation, 35(9), 1562-1570.
[10] Cho, N. H., Shaw, J. E., Karuranga, S., Huang, Y., da Rocha Fernandes, J. D., Ohlrogge, A. W., & Malanda, B. (2018). IDF Diabetes Atlas: Global estimates of diabetes prevalence for 2017 and projections for 2045. Diabetes Research and Clinical Practice, 138(1), 271-281.
[11] Magliano, D., & Boyko, E. J. (2021). IDF Diabetes Atlas. International Diabetes Federation.
[12] NCD Risk Factor Collaboration (NCD-RisC). (2016). Worldwide trends in diabetes since 1980: a pooled analysis of 751 population-based studies with 4·4 million participants. The Lancet, 387(10027), 1513-1530.
[13] Mwaura, J. (2023, May 10). Diabetes Mellitus: Overview of Lab Diagnosis in Kenya. Labtestzote.com.
[14] Wens, J., Vermeire, E., Van Royen, P., Sabbe, B., & Denekens, J. (2005). GPs’ perspectives of type 2 diabetes patients’ adherence to treatment: A qualitative analysis of barriers and solutions. BMC Family Practice, 6(1), 20.
[15] Afkarian, M., Sachs, M. C., Kestenbaum, B., Hirsch, I. B., Tuttle, K. R., Himmelfarb, J., & de Boer, I. H. (2013). Kidney Disease and Increased Mortality Risk in Type 2 Diabetes. Journal of the American Society of Nephrology, 24(2), 302-308.
[16] Parving, H.-H., Lewis, J. B., Ravid, M., Remuzzi, G., & Hunsicker, L. G. (2006). Prevalence and risk factors for microalbuminuria in a referred cohort of type II diabetic patients: A global perspective. Kidney International, 69(11), 2057-2063.
[17] Phillips, K., Hazlehurst, J. M., Sheppard, C., Srikanth Bellary, Hanif, W., Muhammad Ali Karamat, Crowe, F. L., Stone, A., G. Neil Thomas, Javeria Peracha, Fenton, A., Sainsbury, C., Krishnarajah Nirantharakumar, & Dasgupta, I. (2023). Inequalities in the management of diabetic kidney disease in UK primary care: A cross‐sectional analysis of a large primary care database. Diabetic Medicine, 41(1).
[18] Talie Fenta, E., Birhan Eshetu, H., Kebede, N., Ketema Bogale, E., Zewdie, A., Derbew Kassie, T., Fentabil Anagaw, T., Melaku Mazengia, E., & Shiferaw Gelaw, S. (2023). Prevalence and predictors of chronic kidney disease among type 2 diabetic patients worldwide, systematic review and meta-analysis. Diabetology & Metabolic Syndrome, 15(1).
[19] Nakashima, A., Kato, K., Ohkido, I., & Yokoo, T. (2021). Role and Treatment of Insulin Resistance in Patients with Chronic Kidney Disease: A Review. Nutrients, 13(12), 4349.
[20] Mu, X., Wu, A., Hu, H., Zhou, H., & Yang, M. (2023). Prediction of Diabetic Kidney Disease in Newly Diagnosed Type 2 Diabetes Mellitus. Diabetes, Metabolic Syndrome and Obesity: Targets and Therapy, Volume 16, 2061-2075.
[21] Shen, Y., Cai, R., Sun, J., Dong, X., Huang, R., Tian, S., & Wang, S. (2016). Diabetes mellitus as a risk factor for incident chronic kidney disease and end-stage renal disease in women compared with men: a systematic review and meta-analysis. Endocrine, 55(1), 66-76.
[22] Parizadeh, D., Rahimian, N., Samaneh Akbarpour, Azizi, F., & Farzad Hadaegh. (2019). Sex-specific clinical outcomes of impaired glucose status: A long follow-up from the Tehran Lipid and Glucose Study. European Journal of Preventive Cardiology, 26(10), 1080-1091.
[23] Shepard, B. D. (2019). Sex differences in diabetes and kidney disease: mechanisms and consequences. American Journal of Physiology-Renal Physiology, 317(2), F456-F462.
[24] Hecking, M., Bieber, B. A., Ethier, J., Kautzky-Willer, A., Sunder-Plassmann, G., Säemann, M. D., Ramirez, S. P. B., Gillespie, B. W., Pisoni, R. L., Robinson, B. M., & Port, F. K. (2014). Sex-Specific Differences in Hemo`dialysis Prevalence and Practices and the Male-to-Female Mortality Rate: The Dialysis Outcomes and Practice Patterns Study (DOPPS). PLoS Medicine, 11(10), e1001750.
[25] Tekalign, T., Guta, M. T., Awoke, N., Chichiabellu, T. Y., Meskele, M., Anteneh, G., Tura, T. S., & Workie, S. B. (2023). Time to Diabetic Nephropathy and its Predictors Among Diabetic Patients Treated in Wolaita and Dawuro Zone Hospitals, Ethiopia: A Retrospective Cohort Study. International Journal of Nephrology and Renovascular Disease, 16, 163-172.
[26] Verma, A. (2016). Diabetic kidney disease and hypertension: A true love story. JOURNAL of CLINICAL and DIAGNOSTIC RESEARCH, 10(3).
[27] Varleta, P., & Tagle, R. (2018). A feared combination: Hypertension and chronic kidney disease. The Journal of Clinical Hypertension, 21(1), 102-104.
[28] Ke, C., S. Joseph Kim, Shah, B. R., Bierman, A. S., Lipscombe, L. L., Feig, D. S., & Booth, G. L. (2019). Impact of Socioeconomic Status on Incidence of End-Stage Renal Disease and Mortality After Dialysis in Adults With Diabetes. Canadian Journal of Diabetes, 43(7), 483-489. e4.
[29] Saeed, M., Stene, L. C., Reisæter, A. V., Jenssen, T. G., Tell, G. S., Tapia, G., Joner, G., & Torild Skrivarhaug. (2022). End-stage renal disease: incidence and prediction by coronary heart disease, and educational level. Follow-up from diagnosis of childhood-onset type 1 diabetes throughout Norway 1973-2017. Annals of Epidemiology, 76, 181-187.
[30] Cutler, D. M., & Lleras-Muney, A. (2010). Understanding differences in health behaviors by education. Journal of Health Economics, 29(1), 1-28.
[31] Berkowitz, S. A., Meigs, J. B., DeWalt, D., Seligman, H. K., Barnard, L. S., Bright, O.-J. M., Schow, M., Atlas, S. J., & Wexler, D. J. (2015). Material Need Insecurities, Control of Diabetes Mellitus, and Use of Health Care Resources. JAMA Internal Medicine, 175(2), 257.
[32] Walker, R. J., Garacci, E., Campbell, J. A., Harris, M., Mosley-Johnson, E., & Egede, L. E. (2020). Relationship Between Multiple Measures of Financial Hardship and Glycemic Control in Older Adults With Diabetes. Journal of Applied Gerontology, 40(2), 073346482091154.
[33] Shen, Q., Jin, W., Ji, S., Chen, X., Zhao, X., & Behera, T. R. (2019). The association between socioeconomic status and prevalence of chronic kidney disease. Medicine, 98(11), e14822.
[34] Kposowa, A. J., Aly Ezzat, D., & Breault, K. (2021). Diabetes Mellitus and Marital Status: Evidence from the National Longitudinal Mortality Study on the Effect of Marital Dissolution and the Death of a Spouse. International Journal of General Medicine, Volume 14, 1881-1888.
[35] Sabanayagam, C., He, F., Nusinovici, S., Li, J., Lim, C., Tan, G., & Cheng, C. Y. (2023). Prediction of diabetic kidney disease risk using machine learning models: a population-based cohort study of Asian adults. ELife, 12, e81878.
[36] Hu, C., & Steingrimsson, J. A. (2017). Personalized Risk Prediction in Clinical Oncology Research: Applications and Practical Issues Using Survival Trees and Random Forests. Journal of Biopharmaceutical Statistics, 28(2), 333-349.
[37] Krishnamurthy, S., KS, K., Dovgan, E., Luštrek, M., Gradišek Piletič, B., Srinivasan, K., Li, Y.-C. (Jack), Gradišek, A., & Syed-Abdul, S. (2021). Machine Learning Prediction Models for Chronic Kidney Disease Using National Health Insurance Claim Data in Taiwan. Healthcare, 9(5), 546.
[38] Usolo, S. W., Okoth, A., & Angwenyi, D. (2025). Modeling the effect of devolution on youth unemployment rates in Kenya using an autoregressive integrated moving average - intervention model. African Journal of Empirical Research, 6(3), 761-775.
[39] Selby, N. M., & Taal, M. W. (2020). An updated overview of diabetic nephropathy: Diagnosis, prognosis, treatment goals, and latest guidelines. Diabetes, Obesity and Metabolism, 22(S1), 3-15.
Cite This Article
  • APA Style

    Njoka, G. M., Muraya, M., Njoroge, E. W. (2026). Socio-economic, Demographic, and Clinical Predictors of Diabetic Kidney Disease Progression (Renal Function Decline) Among Adults with Diabetes: A Retrospective Cohort Study in Kenya. American Journal of Theoretical and Applied Statistics, 15(2), 27-39. https://doi.org/10.11648/j.ajtas.20261502.11

    Copy | Download

    ACS Style

    Njoka, G. M.; Muraya, M.; Njoroge, E. W. Socio-economic, Demographic, and Clinical Predictors of Diabetic Kidney Disease Progression (Renal Function Decline) Among Adults with Diabetes: A Retrospective Cohort Study in Kenya. Am. J. Theor. Appl. Stat. 2026, 15(2), 27-39. doi: 10.11648/j.ajtas.20261502.11

    Copy | Download

    AMA Style

    Njoka GM, Muraya M, Njoroge EW. Socio-economic, Demographic, and Clinical Predictors of Diabetic Kidney Disease Progression (Renal Function Decline) Among Adults with Diabetes: A Retrospective Cohort Study in Kenya. Am J Theor Appl Stat. 2026;15(2):27-39. doi: 10.11648/j.ajtas.20261502.11

    Copy | Download

  • @article{10.11648/j.ajtas.20261502.11,
      author = {Grace Makena Njoka and Moses Muraya and Elizabeth Wambui Njoroge},
      title = {Socio-economic, Demographic, and Clinical Predictors of Diabetic Kidney Disease Progression (Renal Function Decline) Among Adults with Diabetes: A Retrospective Cohort Study in Kenya},
      journal = {American Journal of Theoretical and Applied Statistics},
      volume = {15},
      number = {2},
      pages = {27-39},
      doi = {10.11648/j.ajtas.20261502.11},
      url = {https://doi.org/10.11648/j.ajtas.20261502.11},
      eprint = {https://article.sciencepublishinggroup.com/pdf/10.11648.j.ajtas.20261502.11},
      abstract = {Diabetic kidney disease (DKD) represents a major global health burden, yet predictive models often overlook socio-economic determinants that may independently influence disease progression. This retrospective cohort study aimed to identify socio-economic, demographic, and clinical predictors of diabetic kidney disease development among diabetic patients in Kenya and compare Cox regression with support vector machine (SVM) models for risk prediction. Data were collected from 756 adult diabetic patients attending Meru Teaching and Referral Hospital and Kerugoya Level 5 Hospital between January 2018 and July 2024 through medical record review and semi-structured questionnaires. Survival analysis employed Kaplan-Meier estimation, log-rank tests, multivariable Cox proportional hazards regression, and survival SVM modeling. During follow-up, 286 participants (37.8%) developed diabetic kidney disease. Multivariable Cox analysis identified seven significant predictors of diabetic kidney disease progression: older age at diabetes diagnosis (adjusted HR=1.023, p=0.002), male gender (HR=1.282, p=0.041), family history of chronic kidney disease (HR=6.919, pp=0.001), and financial hardship (HR=4.524, ppp=0.011) were protective. The SVM model demonstrated marginally superior predictive accuracy (C-index=0.775) versus Cox regression (C-index=0.770). These findings underscore that socio-economic factors function as independent risk modifiers beyond traditional clinical parameters, challenging conventional prediction paradigms that focus exclusively on biomedical indicators. The high incidence of diabetic kidney disease observed highlights an urgent public health challenge requiring integrated screening protocols that assess both clinical and socio-economic risk profiles at diabetes diagnosis. We recommend implementing targeted public health interventions that address financial barriers, promote educational attainment, and support employment opportunities for diabetic patients to mitigate diabetic kidney disease progression in resource-limited settings.},
     year = {2026}
    }
    

    Copy | Download

  • TY  - JOUR
    T1  - Socio-economic, Demographic, and Clinical Predictors of Diabetic Kidney Disease Progression (Renal Function Decline) Among Adults with Diabetes: A Retrospective Cohort Study in Kenya
    AU  - Grace Makena Njoka
    AU  - Moses Muraya
    AU  - Elizabeth Wambui Njoroge
    Y1  - 2026/03/05
    PY  - 2026
    N1  - https://doi.org/10.11648/j.ajtas.20261502.11
    DO  - 10.11648/j.ajtas.20261502.11
    T2  - American Journal of Theoretical and Applied Statistics
    JF  - American Journal of Theoretical and Applied Statistics
    JO  - American Journal of Theoretical and Applied Statistics
    SP  - 27
    EP  - 39
    PB  - Science Publishing Group
    SN  - 2326-9006
    UR  - https://doi.org/10.11648/j.ajtas.20261502.11
    AB  - Diabetic kidney disease (DKD) represents a major global health burden, yet predictive models often overlook socio-economic determinants that may independently influence disease progression. This retrospective cohort study aimed to identify socio-economic, demographic, and clinical predictors of diabetic kidney disease development among diabetic patients in Kenya and compare Cox regression with support vector machine (SVM) models for risk prediction. Data were collected from 756 adult diabetic patients attending Meru Teaching and Referral Hospital and Kerugoya Level 5 Hospital between January 2018 and July 2024 through medical record review and semi-structured questionnaires. Survival analysis employed Kaplan-Meier estimation, log-rank tests, multivariable Cox proportional hazards regression, and survival SVM modeling. During follow-up, 286 participants (37.8%) developed diabetic kidney disease. Multivariable Cox analysis identified seven significant predictors of diabetic kidney disease progression: older age at diabetes diagnosis (adjusted HR=1.023, p=0.002), male gender (HR=1.282, p=0.041), family history of chronic kidney disease (HR=6.919, pp=0.001), and financial hardship (HR=4.524, ppp=0.011) were protective. The SVM model demonstrated marginally superior predictive accuracy (C-index=0.775) versus Cox regression (C-index=0.770). These findings underscore that socio-economic factors function as independent risk modifiers beyond traditional clinical parameters, challenging conventional prediction paradigms that focus exclusively on biomedical indicators. The high incidence of diabetic kidney disease observed highlights an urgent public health challenge requiring integrated screening protocols that assess both clinical and socio-economic risk profiles at diabetes diagnosis. We recommend implementing targeted public health interventions that address financial barriers, promote educational attainment, and support employment opportunities for diabetic patients to mitigate diabetic kidney disease progression in resource-limited settings.
    VL  - 15
    IS  - 2
    ER  - 

    Copy | Download

Author Information
  • Abstract
  • Keywords
  • Document Sections

    1. 1. Introduction
    2. 2. Materials and Methods
    3. 3. Results
    4. 4. Discussion
    5. 5. Conclusions
    Show Full Outline
  • Abbreviations
  • Acknowledgments
  • Author Contributions
  • Data Availability Statement
  • Conflicts of Interest
  • References
  • Cite This Article
  • Author Information