2. Empirical Literature Reviews
Lack of farm inputs, fertilizer and chemicals, lack adequate startup capital and lack of sufficient water are the greatest challenges to sustainable small-scale irrigation in the study area. A study on irrigation scheme the main problems that constrained the supply of adequate irrigation water in the command area were turn abuses, water scarcity, and poor coordination of water distribution
| [18] | Bogale, A., & Shimelis, A. (2009). Household-level determinants of food insecurity in rural areas of Dire Dawa, Eastern Ethiopia. African Journal of Food, Agriculture, Nutrition and Development, 9(9), 1914-1926.
https://doi.org/10.18697/ajfand.30.3740 |
| [24] | Haile, M., Alemu, T., & Kassa, T. (2005). Factors affecting food security in rural Ethiopia: Evidence from Southern Nations, Nationalities and Peoples Region. Journal of Development Studies, 41(4), 591-615. |
[18, 24]
.
The main challenges of irrigation development in Ethiopia especially of small scale irrigation are identified as inadequate awareness of irrigation water management as in irrigation scheduling techniques, water saving irrigation technologies, water measurement techniques, operation and maintenance of irrigation facilities.; inadequate knowledge on improved and diversified irrigation agronomic practices; shortage of basic technical knowledge on irrigation pumps, drip irrigation system, sprinkler irrigations, surface and spate irrigation methods; scheme based approach rather than area/catchments based approach for the development of SSI schemes; inadequate baseline data and information on the development of water resources; lack of experience in design, construction and supervision of quality irrigation project; low productivity of existing irrigation schemes; inadequate community involvement and consultation in scheme planning, construction and implementation of irrigation development, and poor economic background of users for irrigation infrastructure development, to access irrigation technologies and agricultural inputs, where the price increment is not affordable to farmers.
According to
| [26] | IGAD. (2008). Assessing the risks and vulnerabilities of climate change in Kenya, Malawi and Ethiopia Human Development Report (HDR)2007-08 UNDP. Washington, D. C. |
[26]
the main opportunities for the development of irrigation in Ethiopia are identified as emphasis and priorities are given to irrigation in the growth and transformation plan of the country; indigenous knowledge and introduction of promising household water harvesting and micro-irrigation technologies; government’s strong political commitment and encouragement to private sector and public enterprises involvement in irrigation development; abundant water resources, climate and land suitability; availability of inexpensive labor, and availability of suitable lands for irrigation developments especially at arid areas of the country.
Small-scale irrigation is being promoted because of the associated benefits with it. It requires much lower investment costs, and in a majority of cases these costs are borne by the community; it do not involve dams or storage reservoirs, hence no population displacement is involved; less demanding in terms of management, operation and maintenance.
Irrigation and irrigation dams have both positive consequences on food security, asset ownership and income of households. Increased in agricultural production through diversification and intensification of crops grown, increased household income because of on/off/non-farm employment, source of animal feed, improving human health due to balanced diet and easy access and utilization for medication, soil and ecology degradation prevention and asset ownership are contributions of irrigation. The ratio of mean income of irrigation users to non-users exceeds by 37.03% and nutritional status and standard of living of the users also increased by the same factor as income. After construction of the dams on-farm income 16 of 90.77% of the irrigation user households is increased after irrigation utilization despite of the Figure difference. Moreover, irrigation utilization greatly supports the livelihood of the non-users through employment opportunity
| [7] | AGRA. (2013). Africa agriculture status report 2013: Focus on staple crops. Nairobi, Kenya: Alliance for a Green Revolution in Africa (AGRA). |
| [12] | Awulachew, S. B. (2001). Investigation of water resources aimed at multi-objective development with respect to limited data situation: The case of Abaya-Chamo Basin, Ethiopia (PhD dissertation). Dresden University of Technology, Dresden, Germany. Dresdner Wasserbauliche Mitteilungen, Heft 19. |
[7, 12]
.
It is essential to increase agricultural productivity in order to eradicate poverty, improve the economy, and reduce degradation. Irrigation and improved agricultural water management practice is important in Ethiopia due to Population in Ethiopia is rapidly increasing (over 80,000,000 currently), land holding size particularly in highland areas is Decreasing substantially, improved agricultural water management and irrigation can Increase productivity of land, water and labor
| [1] | Abadie, A. (2016). Matching methods in practice: Three examples. Journal of Human Resources, 51(2), 559-599.
https://doi.org/10.3368/jhr.51.2.559 |
| [12] | Awulachew, S. B. (2001). Investigation of water resources aimed at multi-objective development with respect to limited data situation: The case of Abaya-Chamo Basin, Ethiopia (PhD dissertation). Dresden University of Technology, Dresden, Germany. Dresdner Wasserbauliche Mitteilungen, Heft 19. |
[1, 12]
.
Most empirical evidence confirms that land size, livestock, education, soil fertility, non-farm land has a positive effect on rural household food security in several developing countries). Household size, age and gender of household, education, health status, social capital, and employment are also determining households’ income. Research from various developing countries has shown access to credit, land access irrigation, access to infrastructure (roads, electricity), and productive laborer are the main factors affecting rural household income so as food security
| [21] | Creswell. (2009). Research Design Qualitative, Quantitative, and Mixed method Approach; SAGE Publication, Inc. CSA (2007). Summary and Statistical Report of the 2007 Population and Housing Census. |
[21]
.
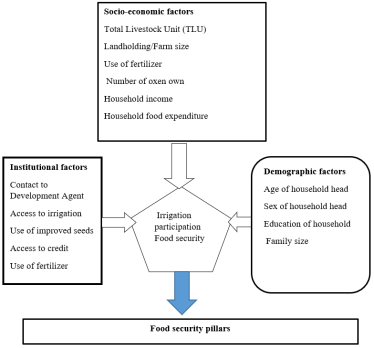
Figure 1. Conceptual framework of modern small-scale irrigation and rural household food security nexus.
Sustainable Household Livelihoods Theory
Sustainable Livelihoods Framework (SLF) serves as a robust theoretical foundation for examining how rural households mobilize resources, capabilities, and strategies to secure food and enhance overall well-being. Applying this framework to the study.
The SLF posits that household livelihoods are shaped by the interaction among five core capital assets natural, physical, human, social, and financial in conjunction with the strategies employed to achieve desired outcomes within a particular vulnerability context and institutional environment. In the Wolaita Zone, where recurrent droughts, erratic rainfall patterns, and land scarcity pose significant challenges to agricultural productivity, small-scale irrigation plays a pivotal role in transforming these livelihood assets and outcomes
| [23] | Emanuel, S. (2011). The role of mass media in agricultural development in Africa: A review. African Communication Research, 4(1), 125-138. |
| [28] | Kefelegn, B. (2007). Livestock ownership and rural livelihood security in Ethiopia: Evidence from household survey data. Ethiopian Journal of Animal Production, 7(1), 1-18. |
[23, 28]
.
Natural Capital: Irrigation enhances access to reliable water resources, a critical input in semi-arid and drought-prone settings. By reducing reliance on inconsistent rainfall, irrigation contributes to stabilized agricultural production, thereby ensuring more dependable food availability
| [17] | Bigsten, A., Kebede, B., Shimeles, A., & Taddesse, M. (2003). Growth and poverty reduction in Ethiopia: Evidence from household panel surveys. World Development, 31(1), 87-106.
https://doi.org/10.1016/S0305-750X(02)00175-4 |
| [32] | Wagnew Ayalneh. (2004). “Socio economic and environmental impact assessment of community based small-scale irrigation in the upper Awash basin”: A case study of four community-based irrigation schemes. An MSc Thesis Presented to the School of Graduate studies of Addis Ababa University. |
[17, 32]
.
Physical Capital: Irrigation infrastructure, whether traditional or improved, constitutes a key physical asset that increases land productivity and facilitates multiple cropping cycles. Such systems enable households to diversify crop production, which supports both food sufficiency and income generation
| [26] | IGAD. (2008). Assessing the risks and vulnerabilities of climate change in Kenya, Malawi and Ethiopia Human Development Report (HDR)2007-08 UNDP. Washington, D. C. |
[26]
.
Human Capital: The adoption of irrigation often necessitates knowledge of water management and crop diversification, promoting skill development among farmers. Capacity-building initiatives, such as training and agricultural extension services, further strengthen households’ ability to optimize resource use effectively
| [16] | Berry, J., Fischer, G., & Guiteras, R. P. (2020). Eliciting and utilizing willingness to pay: Evidence from field trials in Northern Ghana. Journal of Political Economy, 128(4), 1436-1473. https://doi.org/10.1086/705374 |
[16]
.
Financial Capital: Higher agricultural yields resulting from irrigation provide opportunities for surplus production, which can be marketed to generate cash income. This financial improvement enhances households’ ability to purchase food and essential goods during lean periods, mitigating food insecurity risks
| [24] | Haile, M., Alemu, T., & Kassa, T. (2005). Factors affecting food security in rural Ethiopia: Evidence from Southern Nations, Nationalities and Peoples Region. Journal of Development Studies, 41(4), 591-615. |
[24]
.
Social Capital: Many small-scale irrigation schemes involve community-based water user associations, fostering collective action and social networks among farmers. These associations improve access to shared resources, credit facilities, and agricultural inputs, thereby contributing to overall livelihood resilience
| [22] | Diederen, P., van Meijl, H., Wolters, A., & Bijak, K. (2003). Innovation adoption in agriculture: Innovators, early adopters and laggards. Cahiers d’Économie et Sociologie Rurales, 67, 29-50. https://doi.org/10.3406/reae.2003.1714 |
[22]
.
3. Methodology of the Study
3.1. Description of the Study Area
The research was conduct in Wolaita zone of the Southern Nations, Nationalities, and Peoples’ Regional State (SNNPR), Ethiopia. Geographically, it is situated in southwestern Ethiopia about 327 kilometer to south of the national capital, Addis Ababa. The administrative zone is bordered in the north by the Soke River that separates the zone from Hadiya and Kambate zones: in the south by the Hamasa River and Lake Abbaya which separates it from Gamo and Gofazones: in the west the by Omo River that separates it from Dawuro administrative zone and Konta special woreda: and in the east by the Bilate River which separates it from Arsi zone of Oromia regional region and Sidamazone
| [3] | Abayneh, A., & Abebaw, D. (2009). Adoption of improved agricultural technologies in Ethiopia. Ethiopian Development Research Institute (EDRI). |
| [22] | Diederen, P., van Meijl, H., Wolters, A., & Bijak, K. (2003). Innovation adoption in agriculture: Innovators, early adopters and laggards. Cahiers d’Économie et Sociologie Rurales, 67, 29-50. https://doi.org/10.3406/reae.2003.1714 |
[3, 22]
.
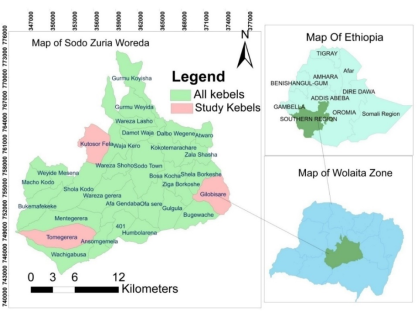
Figure 2. Map of the study area.
Sodo Zuria is one of Woreda which is found in the Wolaita Zone with a distance of 327 km from the south of Addis Ababa, the capital city of Ethiopia. Geographically it is bounded by different Woredas of Wolaita Zone. For instance, Damot Gale at the North and Humbo at the south, DamotWoyide, and Hobicha at the East ByraKoysha and KindoKouyisha at the West. The Agroecology of the study area is about 87% of the total area is Woyna dega, and the rest 17% is dega. There is no coverage of Kola agro ecology. It is between 1626-2954m above sea level
| [34] | WZFED (Wolaita Zone Finance and Economy Development). (2018). Socio-economic data of Wolaita Zone. WZFED: WolaitaSodo. |
[34]
.
3.2. Sampling Techniques and Sampling Size Determination
In this study, multistage sampling techniques were used to select the sample woredas (districts), kebeles (villages), and respondents. In the first stage, one woreda namely Sodo Zuria is purposively selected because this word has five modern small scale irrigation schemes such as Waraza lasho (Lasho), Zala shasha (Tando), Manette gerera (Takacha), Gilobisare (Bsare), and the potentials of the Zone for irrigation activities. Moreover, the woreda has a long history of traditional irrigation practices and have developed indigenous knowledge of irrigation. There are also relatively better modern small-scale irrigation activities in this woredas. Out of five moderns small- scale irrigation schemes of the study area, three are found in the above mentioned kebeles. In the second stage, Kebeles which have modern small-scale irrigation access will be identified from the three kebeles. Out of those, three sample Kebeles were randomly selected through the lottery technique. In the third stage, the total households residing in the three Kebeles were stratified into two strata irrigation user and non-user households.
According to the information obtained from Wolaita zone finance and economic development department (WFED, 2018), the total number of rural households in the three kebeles was 1,200. In order to select the sample household, the researcher uses Yamane Formula, which provides a simple formula to calculate sample sizes.
Where: n = the number of sample size/corrected sample size; N = population size, e = 0.05 Margin of error (MOE) /confidence level or level of precision.
= 1,200/4=300
The sample size of respondents from each village for two strata was determined via probability proportionate to size procedure (See
Table 1).
Table 1. Sample size of the Households.
Sample Kebeles | Irrigation users | Sample household | Non- users | Sample household | Total Sample house- hold |
Waraza lasho | 165 | 42 | 240 | 60 | 102 |
Tando Zala | 150 | 38 | 240 | 60 | 98 |
Gilobisare | 165 | 40 | 240 | 60 | 100 |
Total | 480 | 120 | 720 | 180 | 300 |
3.3. Methods of Data Collection
The study used both primary and secondary data sources.
Primary data (qualitative and quantitative) were collected from irrigation users and non-users across selected kebeles. Quantitative data were gathered using structured, pre-tested questionnaires, while qualitative data were collected through focus group discussions (FGDs) and key informant interviews (KIIs).
Secondary data were compiled from published and unpublished documents, including reports, journals, and government databases.
3.3.1. Questionnaire Survey
A structured household questionnaire was used to gather data on demographics, socio-economic status, food consumption, and irrigation practices. The tool was first prepared in English and translated into Wolayttatto. Three trained enumerators fluent in the local language conducted the survey.
3.3.2. Key Informant Interviews (KIIs)
In-depth interviews were held with 30 purposively selected informants, including elders, DAs, village leaders, irrigation experts, NGO representatives, and non-irrigation users. Interviews focused on local experiences and perceptions related to irrigation and food security. Interviews were recorded with consent to ensure data reliability.
3.3.3. Focus Group Discussions (FGDs)
Six FGDs (one per village) were conducted with participants representing irrigation users, non-users, DAs, experts, administrators, and religious leaders. Each group had 8 participants. Discussions explored perceptions on irrigation practices, food security, technology use, and institutional support.
3.3.4. Field Observation
Field visits were conducted to validate and supplement data through direct observation of biophysical and socio-economic conditions. Informal discussions were held with local officials and experts.
3.3.5. Secondary Data Sources
Desk reviews of relevant literature, reports, and statistical documents were conducted. Sources included CSA data, government bureaus, ministry publications, and online resources.
3.4. Data Analysis
Both descriptive and econometric analyses were applied.
1) Descriptive analysis used frequencies, means, percentages, t-tests, and chi-square tests to compare irrigation users and non-users.
2) Software: SPSS was used for statistical analysis.
To estimate the impact of small-scale irrigation on food security, PSM was used. Irrigation users were treated as the treatment group, and non-users as the control group. A logit model estimated the probability of irrigation participation. Matching quality between the two groups was tested to ensure robustness in the counterfactual estimation.
Propensity Score Matching Estimator
The main pillars of this model are sampled households, irrigation users and potential outcomes (food security) represented by Y. In the case of a binary treatment, the treatment indicator Di equals one if individual i receives treatment (irrigation users) and zero otherwise. The potential outcomes are then defined as: Yi (Di) for each individual i, where i = 1. N and N denote the total population.
The treatment effect for an individual i can be written as
Where: τ i is the treatment effect.
Yi (1) is the outcome of treatment (consumption expenditure per adult equivalent and income of ith household) Yi (0) the outcome of untreated individuals or non-irrigation users (consumption expenditure per adult equivalent and income of ith household).
The problem arises here to measure only one of the potential outcomes is observable for each household. The unobserved outcome is called the counterfactual outcome. Hence, estimating the individual treatment effect τi is not possible at the same time and one has to concentrate on (population) average treatment effects
.
Therefore, the most prominent evaluation parameter is the so-called average treatment effect on the treated (ATT), which focuses explicitly on the effects on those for irrigation scheme users. This is given by:
τ ATT = E[Y (1) |D=1]−E[Y (0) D=1](2)
Where: τ ATT is the average treatment effect (average effect of irrigation users).
E [Y (1) |D = 1] is the expected outcome of irrigation users (consumption expenditure per adult equivalent or income of ith household).
E [Y (0) |D = 1] is the expected outcome of irrigation users if they hadn’t been participated in irrigation (consumption expenditure per adult equivalent or income of ith household).
As the counterfactual mean for those being treated E [Y (0) |D = 1] is not observed, one has to choose a proper substitute for it in order to estimate ATT. The outcomes of individuals from the treatment and comparison groups (non-irrigation users) were differ even in the absence of treatment leading to a ‘selection biases. For ATT it can be noted as
E[Y (1) |D = 1]− E[Y (0) |D = 0]= τAT T + E[Y (0) |D = 1]− E[Y (0) |D = 0](3)
Where: E [Y (0) |D = 0 is the expected outcome of control groups or untreated individuals or non -irrigation users (consumption expenditure per adult equivalent and income of ith house hold).
The difference between the left-hand side of equation (
10) and τATT of equation (
9) is the so-called ‘selection bias’. The true parameter τATT is only identified if:
E[Y (0) |D = 1]− E[Y (0) |D = 0]= 0(4)
To solve the selection bias problem stated in equation (
4) one has to invoke some identifying assumptions: UN confoundedness /conditional independence assumption (CIA) and Overlap assumptions
.
Given that CIA holds and assuming additionally that there is overlap between both groups, the PSM estimator for ATT can be written in general as τ PSM:
ATT= EP(X) |D=1{E[Y (1) |D = 1, P(X)]− E[Y (0) |D = 0, P(X)]}(5)
When estimating the propensity score, two choices have to be made. The first one concerns the model to use for the estimation, and the second one is the variables to include in the model.
3.5. Analysis of the Determinants That Influence the Use of Irrigation
The dependent variable is household’s decision in small-scale irrigation utilization and the independent variables are access to rivers, access to irrigation technology, age of the household head, access to credit, access to development agents, labor, health status of the household head and age of the household head.
Since the dependent variable of this objective is household’s decision in small-scale irrigation utilization which is dichotomous that takes the value of one if the household decided to use irrigation and zero otherwise, binary logistic regression model will be used.
3.6. Model Specification
Following Gujarati (2003), the functional form of logit model can be specified as follows:
For case of explosion, we writ (1) as
The probability the given household is not participating in small-scale irrigation is expressed by (
2) while the probability of participating on small-scale irrigation is (
1).
Therefore, we can write:
Now (Pi/1-Pi is simply the odds ratio in favor of participating the small-scale irrigation. The ratio of the probability that a household will not participate on small-scale irrigation to the probability of that it was participate on small-scale irrigation.
Finally, taking the natural log of equation (
9), we obtain;
Li=1n () =Zi=β0+β1+X1+β2+X2+…-+β2+X2(10)
Where Pi= is a probability being participating on small-scale irrigation, ranges from 0 to 1.
Zi=is a function of n explanatory variables (X) which is also expressed as
Zi=β0+β1+X1β2+X2+…+βn+X2n(11)
β0=is an intercept, β1, β2…βn are slopes of the equation in the model.
Li=is log of the odds ratio, which is not only linear in Xi but also linear in the parameters.
Xi=is vector of relevant household characteristics.
If the disturbance term (Ui) is introduced, the logit model becomes
Zi= β0+β1X1+β2X2+….-+ βnXn +Ui(12)
Model Choice: In principle any discrete choice model can be used. Preference for logit or probit models (compared to linear probability models) derives from the well-known shortcomings of the linear probability model, especially the unlikeliness of the functional form when the response variable is highly skewed and predictions that are outside the [0; 1] bounds of probabilities.
3.7. Measuring Household Food Security
Food security is outcome variable to estimate improvement on food security status of households that use and don’t use SSI (small scale irrigation) schemes. In order to assess the impact of irrigation on improving on food security of households, a (Greer and Thorbecke, 1986) method of food energy intake measurement was employed. It is measured by food poverty line which is the minimum amount of food (Recommended Daily Allowance (RDA) of 2200 Kcal) intake per adult equivalent to stay healthy life.
Total value of food consumption (Xj) in birr by each household, which is equal to the sum of the value of food purchase (Vj) and the value of own production consumption (Kj), was determined.
Total value of food consumption per adult equivalent was derived by dividing the total value of food by household adult equivalent:
Where Xj = Total value of food consumption by jth household
Hj = Adult equivalent for jth household
F = Total value of food consumption per adult equivalent units
3.8. Definition and Hypotheses of Variables
3.8.1. Dependent Variable
This is a binary (dummy) variable indicating whether a household participates in irrigation activities. It takes the value of 1 if the household uses irrigation and 0 otherwise.
This is a continuous variable measured using the physical consumption of food by the household. Respondents responsible for food preparation were asked to report the type and amount of food consumed by the household over the past seven days. A 7-14-day food recall period is considered sufficient to determine household consumption patterns
| [2] | Abadie, A., & Imbens, G. W. (2016). Matching on the estimated propensity score. Econometrics Econometrica, 84(2), 781-807. https://doi.org/10.3982/ECTA11293 |
| [11] | Amaza, P. S., Bila, Y., & Iheanacho, A. C. (2006). Identification of factors that influence technical efficiency of food crop production in West Africa: Empirical evidence from Borno State, Nigeria. Journal of Agriculture and Rural Development in the Tropics and Subtropics, 107(2), 139-147. |
| [28] | Kefelegn, B. (2007). Livestock ownership and rural livelihood security in Ethiopia: Evidence from household survey data. Ethiopian Journal of Animal Production, 7(1), 1-18. |
[2, 11, 28]
.
3.8.2. Independent Variables and Hypotheses
1) Sex of Household Head (SEXOHH): Dummy variable (1 = male, 0 = female). Male-headed households are hypothesized to have higher participation in irrigation due to fewer domestic responsibilities
| [9] | Amare, D., & Belayneh, L. (2013). Determinants of income diversification among rural households: The case of smallholder farmers in Fedis district, Eastern Hararghe zone, Ethiopia. Journal of Development and Agricultural Economics, 5(3), 120-128. https://doi.org/10.5897/JDAE12.104 |
[9]
.
2) Age of Household Head (HHAGE): Continuous variable measured in years. The effect of age is ambiguous while younger farmers may be more innovative), older ones may have more farming experience
| [22] | Diederen, P., van Meijl, H., Wolters, A., & Bijak, K. (2003). Innovation adoption in agriculture: Innovators, early adopters and laggards. Cahiers d’Économie et Sociologie Rurales, 67, 29-50. https://doi.org/10.3406/reae.2003.1714 |
[22]
.
3) Education Level (HHEDUC): Measured in completed formal schooling years. It is expected to have a positive effect on food security through better farm management
| [9] | Amare, D., & Belayneh, L. (2013). Determinants of income diversification among rural households: The case of smallholder farmers in Fedis district, Eastern Hararghe zone, Ethiopia. Journal of Development and Agricultural Economics, 5(3), 120-128. https://doi.org/10.5897/JDAE12.104 |
| [10] | Amare, M., & Belaineh, L. (2013). Determinants of household participation in small-scale irrigation and its impact on crop income in Ethiopia. Journal of Economics and Sustainable Development, 4(17), 36-45. |
[9, 10]
.
4) Household Size (HSIZE): Measured in adult equivalents. Larger households are hypothesized to contribute positively to food security due to greater labor availability
.
5) Credit Access (CREDIT): Dummy variable (1 = access, 0 = no access). Credit access is expected to positively influence both irrigation participation and food security
| [30] | Norton, G. W., Alwang, J., & Masters, W. A. (2010). Economics of agricultural development: World food systems and resource use (2nd ed.). Routledge. ISBN: 9780415494243. |
[30]
.
6) Access to Irrigation (ACCIRR): Dummy variable (1 = access, 0 = no access). It is hypothesized to positively affect food production and availability
| [4] | Abdissa, F., Tesema, G., & Yirga, C. (2017). Impact analysis of small-scale irrigation schemes on household food security: The case of Sibu Sire District in Western Oromia, Ethiopia. Irrigation & Drainage Systems Engineering, 6(2), 187.
https://doi.org/10.4172/2168-9768.1000187 |
| [29] | Khatun, D., & Roy, B. C. (2012). Determinants and constraints to rural livelihood diversification in West Bengal. Agricultural Economics Research Review, 25(1), 127-136.
https://doi.org/10.1177/0971344120120113 |
[4, 29]
.
7) Cultivated Land Size (CULTLAND): Continuous variable measured in hectares. Larger land size is expected to enhance food production and improve food security
| [28] | Kefelegn, B. (2007). Livestock ownership and rural livelihood security in Ethiopia: Evidence from household survey data. Ethiopian Journal of Animal Production, 7(1), 1-18. |
[28]
.
8) Use of Improved Seeds (USISED): Continuous variable (kg per hectare). Expected to have a positive influence on food production and security
| [8] | Abera, A., Ahmed, F., & Abebe, A. (2017). Factors that affect the participation in irrigation practice and its effects on rural household farm income: The case of Boloso Sore Woreda, Wolayta Zone, Southern Ethiopia. International Journal of Contemporary Research and Review, 8(9), 20293-20300. |
[8]
.
9) Livestock Ownership (TLU): Total number of livestock measured in Tropical Livestock Units. Positively associated with food security due to income and food contributions.
10) Use of Fertilizer (USEFERT): Dummy variable (1 = yes, 0 = no). Adequate fertilizer use is hypothesized to increase yields and thus improve food security
| [5] | Abebaw, D. (2003). Dimensions and determinants of food insecurity among rural households in Dire Dawa, Eastern Ethiopia (Unpublished master’s thesis). Addis Ababa University. |
[5]
.
11) Contact with Development Agents (ContDA): Continuous variable measured as the number of contacts per month. Expected to positively influence food production and security
| [6] | Adugna, T., & Sileshi, G. (2013). Agricultural extension and development agents’ performance in Ethiopia: A review. Ethiopian Journal of Agricultural Sciences, 23(1), 45-59. |
| [15] | Bacha, D., Namara, R. E., Bogale, A., & Tesfaye, A. (2011). Impact of small-scale irrigation on household poverty: Empirical evidence from the Ambo district in Ethiopia. Irrigation and Drainage, 60(1), 1-10.
https://doi.org/10.1002/ird.550 |
[6, 15]
.
12) Number of Oxen Owned (NUMBOXEN): Continuous variable. Owning more oxen increases the ability to farm efficiently and on time, positively influencing food security.
13) Annual Income (ANINC): Continuous variable measured in Ethiopian Birr. Higher income is expected to reduce food insecurity
| [13] | Ayalneh, B. (2002). Determinants of food insecurity in rural Ethiopia: An econometric analysis for South Wollo Zone of Amhara Region. African Development Bank. |
[13]
.
14) Access to Mass Media (MASMEDIA): Frequency of listening to radio or watching television per week. Access to media is expected to improve knowledge and income diversification, thereby improving food security
| [26] | IGAD. (2008). Assessing the risks and vulnerabilities of climate change in Kenya, Malawi and Ethiopia Human Development Report (HDR)2007-08 UNDP. Washington, D. C. |
[26]
.
15) Distance from Farm to Water Source (DFFTSW): Continuous variable measured in meters. A shorter distance is expected to facilitate irrigation participation and improve food security
| [31] | Petros Woldemariam and Yishak Gecho. Determinants of small-scale irrigation Use: The case of Boloso Sore District, Wolaita Zone, Southern Ethiopia. American Journal of Agriculture and Forestry. Vol. 5, No. 3, 2017, pp. 49-59.
https://doi.org/10.11648/j.ajaf.20170.1 |
[31]
.
4. Results and Discussions
In this section, the result and discussion on the impact of small-scale irrigation on rural household food security of irrigation user households were presented in comparison with non-users of irrigation. About 300 household heads were participated and interviewed in the study. Fortunately, the response rate of sampled households was found to be 100%. The section is divided into five subsections: first, socio-demographic and socio-economic, characteristics and type of services related to small scale irrigation are presented; Second, the impact of SSI on household food security as captured by income, crop production, food utilization, asset building, and consumption expenditure is explained.
4.1. Impact of SSI on Food Consumption Expenditure of Sampled Households
Table 2 presents household food consumption expenditure per adult equivalent, calculated using weekly consumption data collected in January and annualized as a key food security indicator. The monetary value of consumed food items was estimated based on local market prices. The average annual food expenditure per adult equivalent was 1,327.67 birr, exceeding the national food poverty line per adult per year. Statistical analysis in
Table 2 indicates a significant difference between irrigation users and non-users in average annual food expenditure per adult equivalent, suggesting that irrigation users are more likely to achieve food security than non-users.
The food energy intake method by
| [12] | Awulachew, S. B. (2001). Investigation of water resources aimed at multi-objective development with respect to limited data situation: The case of Abaya-Chamo Basin, Ethiopia (PhD dissertation). Dresden University of Technology, Dresden, Germany. Dresdner Wasserbauliche Mitteilungen, Heft 19. |
| [28] | Kefelegn, B. (2007). Livestock ownership and rural livelihood security in Ethiopia: Evidence from household survey data. Ethiopian Journal of Animal Production, 7(1), 1-18. |
[12, 28]
was used to compute the food expenditure to acquire the minimum energy required per adult equivalent per day (2200 Kcal). To acquire the food expenditure for sampled households the local market price for the different food types was collected from agriculture office.
Table 2 presents’ descriptive statistics results of sample households based on their mean calorie and mean income. The survey results show that irrigation users and non-irrigation users had mean calorie of 16827.77344 and 10199.69186 calories respectively. Similarly, participant and non-participants had mean income of 19677.9141 and 7198.3081 respectively. The t-test result shows the presence of significant income and calorie intake difference among participant and non-participant at 1 percent and 1 percent significant level respectively. This clearly shows that participants are better off in calorie and income than non-participant households.
Table 2. Mean difference test for consumption and income of the households.
Variables | Total N (300) | Users (128) | Non users (172) | t-value |
Annual food consumption expenditure (Calorie per AE) | Mean | 13027.67333 | 16827.77344 | 10199.69186 | 1.246*** |
SD | 5608.800910 | 5528.349543 | 3668.018459 |
Mean Annual income | Mean | 12522.9400 | 19677.9141 | 7198.3081 | 1.098*** |
SD | 11513.58369 | 14047.685 | 4288.62193 |
Source: Own survey ***, ** and * significant at 1%, 5% and 10%
4.2. Determinants of Household’s Participation in Small Scale Irrigation in the Study Area
The logit regression results (
Table 3) indicate that the model is statistically significant at the 1% level, confirming that the null hypothesis of all coefficients being zero is rejected. The model demonstrated strong predictive power, correctly classifying 91% of observations based on the 0.5 probability threshold. The Pearson chi-square test further confirmed a good overall model fit at the 1% level, validating the meaningful interpretation of results.
Out of 16 explanatory variables, 11 were found significant (p < 0.1) in determining household poverty status. These include household age, education, size, annual income, access to credit, total cultivated land, use of improved seed, number of oxen, access to mass media, distance from farm to water source, and annual food consumption expenditure. The remaining five variables showed no significant effect on food security.
Table 3. Determinants of household’s participation in small scale irrigation.
Variables | Coef. | Odds Ratio | z-value | P-value | Marginal effect |
SEXOHHH | .249513 | .488644 | 0.87 | 0.385 | .0996199 |
HHAGE | .1019222 | 1.107297 | 1.19 | -0.102 | .0090652 |
HHEDUC | .1056254 | .8997616 | 0.45 | 0.006 | .093946 |
HHSIZE | .2877141 | .333376 | 0.41 | 0.068 | .0255901 |
ANINC | .000565 | .000565 | 2.75 | 0.006 | .0000503 |
ACCCR | .117241 | 1.38963 | 1.70 | 0.089 | .3321436 |
ACCIRR | .921154 | .45862 | 2.13 | 0.033 | .4102424 |
TCl | .234674 | .03917 | 2.68 | 0.007 | .376644 |
IU | .43139 | .37468 | 1.09 | 0.275 | .1697781 |
USISED | .217416 | .0400584 | 1.67 | 0.095 | .4123623 |
TLU | .485903 | .418954 | 1.78 | 0.076 | .1321604 |
ContDA | .882517 | .85917 | 1.06 | 0.290 | .2563793 |
NOOXEN | .438499 | .214366 | 1.01 | 0.003 | .1279442 |
ACMM | .214086 | .367215 | 0.93 | 0.103 | .1148698 |
DFFTSW | -.102165 | .0001231 | 2.92 | 0.004 | .8006783 |
AFCEXP | .0008869 | .000887 | 2.38 | 0.017 | .0000789 |
_cons | 1.49252 | .36493 | -1.81 | 0.070 | .0996199 |
Logistic regression Obs. = 300 |
LR chi2 (21) = 374.76, Prob > chi2 = 0.000 |
Pseudo R2 = 0.9154 |
Log likelihood = 17.323665 |
Source: survey result
***, ** and * indicate it is significant at 1%, 5%and 10% Probability level, respectively.
4.3. Explanation of Significant Explanatory Variables
4.3.1. Household Education (HHEDUC)
Education plays a critical role in enhancing household participation in irrigation activities. The results indicate that household education was positively and significantly associated with participation at the 10% level. Literate farmers are better equipped to access information, adopt modern agricultural technologies, and effectively manage resources. Education improves decision-making skills, enabling farmers to utilize irrigation systems more efficiently. Furthermore, educated household heads are more likely to be aware of the benefits of irrigation for improving productivity and reducing food insecurity. This finding aligns with studies by
| [14] | Babatunde, R. O. (2013). On-farm and off-farm works: Complement or substitute? Evidence from rural Nigeria. Presented at the Fourth International Conference of the African Association of Agricultural Economists (AAAE), Hammamet, Tunisia. https://doi.org/10.22004/ag.econ.160437 |
| [30] | Norton, G. W., Alwang, J., & Masters, W. A. (2010). Economics of agricultural development: World food systems and resource use (2nd ed.). Routledge. ISBN: 9780415494243. |
[14, 30]
which emphasize the strong relationship between education and household food security.
4.3.2. Access to Credit (ACCCR)
Access to credit emerged as another significant determinant of participation in small-scale irrigation at less than the 10% significance level. Credit provides households with the financial means to invest in agricultural inputs such as improved seeds, fertilizers, and labor, which are essential for maximizing the benefits of irrigation. Households with access to credit were found to be 33% more likely to participate in irrigation activities compared to those without credit. This indicates that credit enhances farmers’ capacity to diversify crops, adopt new technologies, and ultimately improve productivity and income levels.
Total Cultivated Land (TCL):
The size of land cultivated by households had a strong positive association with irrigation participation, significant at the 1% level. Larger landholdings create greater opportunities for households to utilize irrigation technologies effectively and engage in crop diversification. Households with more land can produce both staple and cash crops, which not only improves income but also ensures better household food security. The odds ratio suggests that the probability of remaining food insecure decreases significantly with an increase in cultivated land size. This finding confirms previous research that land is one of the most critical resources in rural farming systems.
4.3.3. Total Livestock Holding (TLU)
Livestock ownership significantly influenced participation in irrigation at the 10% level. Livestock are an important asset for rural households, serving multiple functions such as providing income through sales, food (milk and meat), and manure for soil fertility. Moreover, livestock can act as a form of financial security and a means to purchase agricultural inputs. Households with higher livestock holdings are more likely to invest in irrigation as they are generally better off economically. This result is consistent with the findings of
| [25] | Hussain, I. (2004). Assessing impacts of irrigation on poverty and income distribution. International Water Management Institute (IWMI). |
| [27] | IPTRID (1999) Poverty reduction and irrigated agriculture’ (International program for technology and research in irrigation and Drainage) IWMI, (2005), Adoption Constraints and Drivers. |
[25, 27]
who reported livestock as a key determinant of poverty reduction and food security.
Household Size (HHSIZE):
Household size was also positively associated with irrigation participation, significant at the 10% level. Larger households often have greater labor availability, which is essential for managing irrigation activities that are labor-intensive. Moreover, households with more members have higher food requirements, which creates an incentive to participate in irrigation to increase agricultural output. This is particularly important in rural areas where household members are often the primary source of labor for agricultural tasks.
4.3.4. Use of Improved Seeds (USISED)
The use of improved seed varieties showed a positive and significant relationship with irrigation participation at the 10% level. Adoption of improved seeds is generally associated with farmers who are more progressive and willing to adopt modern agricultural technologies, including irrigation. Improved seeds, when combined with irrigation, result in higher crop yields, enhanced income, and improved food security. This finding reflects the complementary relationship between irrigation and other agricultural technologies.
4.3.5. Distance from Water Source (DFFTSW)
Proximity to a water source was found to have a strong negative effect on irrigation participation, significant at the 1% level. The further a household is located from the water source, the less likely it is to participate in irrigation activities. Distance increases the cost and time required to transport water or manage irrigation systems, reducing the economic feasibility of participation. Conversely, households located near water sources can irrigate their crops more easily and cost-effectively, enhancing their productivity and food security. Households located far from water often resort to non-farm or less water-intensive activities to sustain livelihoods.
4.3.6. Annual Income (HHAINC)
Household income showed a positive and significant association with irrigation participation at the 5% level. Higher income levels provide households with better financial capacity to cover the costs associated with irrigation, such as maintenance, water charges, and investment in complementary technologies. Households with higher incomes are also more resilient to risks and can diversify their cropping systems, thereby improving food security. This finding is supported by
| [19] | Bryman, A. (2006). Integrating quantitative and qualitative research: How is it done? Qualitative Research, 6(1), 97-113.
https://doi.org/10.1177/14687941060 |
| [25] | Hussain, I. (2004). Assessing impacts of irrigation on poverty and income distribution. International Water Management Institute (IWMI). |
[19, 25]
who reported income as a critical determinant of technology adoption and food security.
4.3.7. Annual Food Consumption Expenditure (AFCEXP)
Annual food consumption expenditure was positively and significantly associated with household food security at the 1% level. This variable reflects household purchasing power and the ability to meet food needs either through own production or market purchases. Higher food expenditure often indicates better economic status, which enables households to invest in irrigation and related agricultural improvements, thereby reducing vulnerability to food insecurity.
4.3.8. Number of Oxen (NOOXEN)
Ownership of oxen significantly influenced participation at the 5% level. Oxen are essential for land preparation, particularly in traditional farming systems where mechanization is limited. Households owning oxen can cultivate larger areas and make better use of irrigation infrastructure compared to those without oxen. Oxen ownership also reflects wealth status, which correlates with the ability to adopt improved farming technologies. This finding is consistent with evidence highlighting oxen as a critical factor in smallholder agricultural productivity.
4.4. The Impact of Small-scale Irrigation on Food Security in the Study Area
There are three tasks that should be done before matching irrigation user households with non -user households. Estimating propensity score based on identified explanatory variable for all sampled households is the first task, which was done in previous section. Imposing common support condition on the propensity score distribution of user and non- user household’s is the second task. Discarding observations whose propensity score is outside the common support region is the final task. Since one of the main assumptions of the propensity score was balancing the observable covariates across the observation based on the overlapping and common supporting region.
Table 4 shows that, before matching, the observed covariates strongly influenced group users of irrigation, revealing notable imbalance between the treatment and control groups. It is indicated by the relatively high Pseudo R² (0.185) and the statistically significant LR chi-square (χ² = 42.79). and p < 0.001. There is wide disparities in baseline covariates are fully established, with a mean bias of 0.0001%, which could introduce bias into treatment effect estimation. There is evidence from these changes that matching reduced selection bias by making groups look alike. As a consequence, the baseline may be less likely to confound the effects of a match. Thus, conclusions on causality obtained from the matched sample are more internally valid.
Table 4. Chi2 test for the joint significance of variables.
Sample Pseudo R2 LR chi2 P> chi2 |
Unmatched 0.1935 42.79 0.0001 |
Matched 0.018 2.62 0.998 |
Source: survey result
4.5. Average Treatment Effect on the Treated: Matching Algorithms
In the preceding section, the quality of covariate matching between irrigation users and non-users was verified using matching quality indicators to ensure a robust estimation of the Average Treatment Effect on the Treated (ATT). In this subsection, the ATT for irrigation participation was estimated for two outcome variables: average annual income and food consumption expenditure per adult equivalent, using a kernel bandwidth of 0.1.
As presented in
Table 5, the ATT for average annual income per adult equivalent among irrigation users increased by approximately 876-930 Birr across different matching algorithms. When compared to households with similar characteristics that did not participate in irrigation, this difference was statistically significant at the 1% level. The higher ATT observed under the kernel matching algorithm suggests that irrigation participation substantially enhances household income. Nearest neighbour matching and, and caliper matching are selected because each method addresses selection bias differently and provides a robustness check for the estimated treatment effect. This improvement can be attributed to the opportunities provided by irrigation, such as diversifying cropping patterns, cultivating cash crops, increasing productivity, and ultimately improving agricultural output and income. These findings align with
| [31] | Petros Woldemariam and Yishak Gecho. Determinants of small-scale irrigation Use: The case of Boloso Sore District, Wolaita Zone, Southern Ethiopia. American Journal of Agriculture and Forestry. Vol. 5, No. 3, 2017, pp. 49-59.
https://doi.org/10.11648/j.ajaf.20170.1 |
[31]
, who reported similar positive effects of small-scale irrigation on food security in Oromia.
Table 5. Impact of SSI scheme in the average annual income per adult equivalent.
Types of Match in | On support | ANINCAE | ATT | Boot standard error | t test |
treated | control | treated | control |
Neighbor (1) | 54 | 113 | 3872 | 2995 | 876 | 304.41 | 2.88 |
Neighbor (2) | 54 | 113 | 3872 | 3023 | 848 | 284.98 | 2.98 |
Neighbor (3) | 54 | 113 | 3872 | 2996 | 876 | 282.17 | 3.11 |
Neighbor (4) | 54 | 113 | 3872 | 2997 | 895 | 276.76 | 3.24 |
Neighbor (5) | 54 | 113 | 3872 | 3012 | 860 | 271.77 | 2.34 |
Caliper (0.01) | 43 | 113 | 3929 | 3119 | 809 | 346.37 | 2.88 |
Caliper (0.1) | 54 | 113 | 3872 | 2995 | 876 | 304.41 | 2.88 |
Caliper (0.25) | 54 | 113 | 3872 | 2995 | 876 | 304.41 | 2.88 |
Caliper (0.5) | 54 | 113 | 3872 | 2995 | 876 | 304.41 | 3.69 |
radius bw (0.01) | 54 | 113 | 3858 | 2961 | 897 | 243.08 | 3.79 |
radius bw (0.1) | 54 | 113 | 3872 | 2961 | 911 | 240.69 | 3.79 |
radius bw (0.25) | 54 | 113 | 3872 | 2961 | 911 | 240.69 | 3.79 |
radius bw (0.5) | 54 | 113 | 3872 | 2961 | 911 | 240.69 | 3.7 |
kernel bw (0.01) | 43 | 113 | 3992 | 3079 | 849 | 328.62 | 2.59 |
kernel bw (0.1) | 54 | 113 | 3872 | 2942 | 930 | 262.42 | 3.54 |
kernel bw (0.25) | 54 | 113 | 3872 | 2942 | 930 | 256.41 | 3.63 |
kernel bw (0.5) | 54 | 113 | 3872 | 2942 | 930 | 259.59 | 3.76 |
Source: Survey result
4.6. Conclusions and Recommendations
Participation in small-scale irrigation was influenced by several factors, including education, household size, income, access to credit and irrigation, total cultivated land, use of improved seeds, livestock ownership, oxen, distance to the water source, and annual food expenditure. To obtain a reliable estimate of its impact, these factors were controlled using Propensity Score Matching, which paired 169 irrigation users with 118 non-users who shared similar characteristics except for program participation. The matched sample passed quality tests, ensuring robust analysis. Results from the econometric model revealed significant relationships between irrigation participation and variables such as age, education, income, land size, and distance from water sources. Other factors like access to credit, livestock units, improved seeds, and food expenditure also showed varying significance levels. On average, irrigation users consumed 814 more calories and earned 4,106 Ethiopian birr more than non-users, indicating a substantial improvement in food security and income. These findings demonstrate that small-scale irrigation significantly enhances household well-being, encouraging the adoption of modern farming practices and supporting future investment in irrigation programs.