Research Article | | Peer-Reviewed

A Transparent AI-Driven Ensemble Learning Approach for Predicting Mental Health Risks among University Students in Kenya

Received: 8 September 2025     Accepted: 7 October 2025     Published: 20 August 2026
Views:       Downloads:
Abstract

This study addresses the escalating mental health crisis among university students in Kenya, where psychological distress, driven by academic, financial, social, and transitional pressures, is increasingly prevalent yet under-prioritized in public health discourse. While global studies report distress rates exceeding 75% and Kenyan prevalence exceeds 40%, there remains a critical lack of localized, data-driven models to enable early detection in sub-Saharan African university settings. To address this gap, we developed transparent ensemble machine learning models, Random Forest (RF) and Extreme Gradient Boosting (XGBoost), to predict mental health distress levels (low, moderate, high) among 1,128 students across universities in Tharaka Nithi County, Kenya. Using a structured questionnaire incorporating demographic, academic, financial, psychosocial, and Quarter-Life Crisis (QLC) factors, we trained the models on 70% of the data and evaluated them on the remaining 30%. Both models achieved high performance: RF and XGBoost attained 98.8% accuracy (95% CI: 96.9–99.7%), Cohen’s Kappa of 0.978, and multi-class AUCs of 1.000 (RF) and ≥0.997 (XGBoost). Class-specific metrics revealed near-perfect precision, recall, and F1-scores; for high distress, both models achieved 100% sensitivity and specificity, with F1-scores of 1.000 (RF) and 0.988 (XGBoost). SHAP and feature importance analyses identified “Quarter-Life Crisis,” faculty of study (especially Science, Technology, Nursing, and Engineering), personal/mental health history, financial stress, and residence as top predictors. These findings support the use of interpretable AI for equitable, early-risk screening. However, careful attention must be paid to ethical considerations, including data privacy, potential algorithmic bias, and mental health stigma. We recommend integrating such models into university wellness platforms to enable proactive, targeted support for at-risk students.

Published in International Journal of Psychological and Brain Sciences (Volume 11, Issue 2)
DOI 10.11648/j.ijpbs.20261102.12
Page(s) 35-51
Creative Commons

This is an Open Access article, distributed under the terms of the Creative Commons Attribution 4.0 International License (http://creativecommons.org/licenses/by/4.0/), which permits unrestricted use, distribution and reproduction in any medium or format, provided the original work is properly cited.

Copyright

Copyright © The Author(s), 2026. Published by Science Publishing Group

Keywords

Ensemble Learning, Mental Health Risk Prediction, Random Forest, XGBoost, Quarter Life Crisis, Explainable AI, University Students

1. Introduction
Mental health distress among university students has emerged as a global public health concern, with increasing prevalence linked to academic pressure, financial instability, and social isolation . Recent global estimates suggest that nearly one in three university students experiences moderate to severe psychological distress, including symptoms of anxiety, depression, and emotional exhaustion . This crisis impairs academic performance and poses long-term consequences for well-being and employability . In response, data-driven approaches such as machine learning (ML) have gained traction for identifying individuals at risk with greater accuracy and scalability . ML models, especially ensemble learning techniques, offer robust predictive performance by integrating multiple learners to capture complex, nonlinear patterns in high-dimensional data . Specifically, algorithms like Random Forest and Extreme Gradient Boosting (XGBoost) have shown promise in mental health prediction tasks due to their interpretability and adaptability . Integrating ML with mental health research enables early risk detection, supports targeted interventions, and enhances mental health service delivery in university settings .
According to the report by the World Health Organization 2021, globally, one in seven 10-19-year-olds experiences a mental disorder, accounting for 14.28% of the global burden of disease in this age group . Besides, the report also showed that depression, anxiety, and behavioral disorders are among the leading causes of illness and disability among university students. Suicide is the fourth leading cause of death among 15–29-year-olds. The consequences of failing to address mental health conditions among university students impair both physical and mental health and limit opportunities to lead fulfilling lives as adults.
There has been a notable increase in mental distress among university students globally, further exacerbated by the COVID-19 pandemic, which led to frequent lockdowns and disrupted learning schedules . Despite this, mental health issues among university students in sub-Saharan Africa, including Kenya, have not received as much attention as medical health problems. Locally, a significant gap in research on university student mental health indicates a need for more studies in this area. In their study, found that globally, the prevalence of mental health distress among university students is reported to exceed 75%, with some studies indicating rates as high as 95% in recent years. In sub-Saharan Africa, found that the prevalence is below 50%, while in Kenya, the prevalence is above 40%. Key determinants of mental distress include gender, substance use, lack of social support, early years of university education, and poor academic performance. The precise extent of mental distress among university students in Kenya remains an area that has been less explored.
In Kenya, the mental health challenges faced by university students are further compounded by socioeconomic factors and limited access to mental health resources. The pressures of university life, combined with the financial burden of education and the constraints of available support systems, create a unique environment of stress and mental health distress . Cultural and identity factors, such as cultural adjustment and experiences of discrimination, also impact mental health, particularly in increasingly diverse academic settings ; . As the mental health crisis among students continues to escalate, especially in Kenya, there is a pressing need for effective predictive models and targeted interventions to support student well-being.
Mental health is a vital aspect of overall well-being, encompassing emotional, psychological, and social functioning . Globally, one in four individuals experiences a mental health condition, with university students increasingly affected due to academic, financial, and social pressures . In Kenya, socioeconomic challenges and limited mental health resources exacerbate distress among students . Key predictors include demographic factors such as age, gender, and year of study , academic pressure , financial stress , social and environmental factors , family expectations , lifestyle habits , and identity challenges . Technology use, chronic illness, and the “quarter-life crisis” further contribute to mental health distress . Using the Kessler K-6 scale, this study categorizes mental distress into low, medium, and high levels . A complex interplay of various factors influences the mental health of university students. Identifying and understanding these predictors is crucial for designing effective interventions. This study focuses on demographic information, academic pressure, financial stress, social and environmental factors, personal and family issues, lifestyle and health factors, transition to university life, cultural and identity factors, technology and social media use, personal and mental health challenges, and quarter-life crisis as factors responsible for mental health distress among university students in Tharaka Nithi County, Kenya.
As societal awareness of the impacts of psychological stress grows, investigating its influencing factors becomes increasingly vital . The authors utilized data from the Health Information National Trends Survey from different survey cycles; cycle 3 and cycle 4, which provided a sample size of 5484. Model performance was evaluated using accuracy, precision, recall, F1-score, and AUC metrics. Predictor selection in logistic regression employed forward selection, backward selection, and stepwise regression, while variable importance values guided predictor identification in the other machine learning methods. Among the four models, the artificial neural network (ANN) demonstrated the highest predictive performance (AUC = 73.90%) .
The study by significantly contributes to the understanding of predictors of psychological distress using machine learning methods, particularly in utilizing a large dataset from the HINTS survey; however, it primarily focuses on general psychological distress, particularly for individuals above 18 years old. Early prediction of mental health issues is crucial for timely diagnosis and treatment . The author investigated various machine learning algorithms for predicting mental health problems using survey data from Open Sourcing Mental Illness (OSMI). The algorithms evaluated include Logistic Regression, Gradient Boosting, Neural Networks, K-Nearest Neighbors (KNN), and Support Vector Machine (SVM), alongside an ensemble approach that combines these methods. New approaches like Extreme Gradient Boosting (XGBoost) and Deep Neural Networks were also assessed. The study results showed that Gradient Boosting achieved the highest accuracy at 88.80%, followed closely by Neural Networks at 88.00%. Extreme Gradient Boosting and Deep Neural Networks achieved 87.20% and 86.40% accuracy, respectively. The ensemble classifier reached 85.60%, while the remaining classifiers scored 82.40% and 84.00%. The study demonstrated that Gradient Boosting is the most effective for mental health bi-classification tasks.
In a study to evaluate the best-performing machine learning classification model, conducted a study on the classification of psychological disorders by Feature Ranking and Fusion using Gradient Boosting. Using feature ranking and fusion proved to be a promising approach to modelling psychological and mental disorders. Feature selection in the study was done using random forest-recursive feature elimination and a cross-validation approach. Cross-validation in the study was done using 10-fold cross-validation. The results showed that ranking and fusion using Gradient boosting produced the best-performing model with an accuracy of approximately 97.71% and a balanced accuracy of approximately 87.93%. Classification-based machine learning models such as Random Forest and XGBoost offer practical tools for early identification of at-risk students, informing data-driven mental health interventions and targeted support strategies .
2. Materials and Methods
2.1. Research Design
This research adopted a cross-sectional design with quantitative data to evaluate how well different machine learning algorithms predict mental health distress among Tharaka Nithi County, Kenya university students. The design allows for assessing mental health status and its associated risk factors at a specific time, providing a snapshot of the prevalence of distress . It is efficient, cost-effective, and suitable for identifying patterns and relationships in large populations without requiring follow-up, making it ideal for building predictive models based on current student data.
2.2. Research Instruments and Data Collection
This study employed a cross-sectional design using quantitative data to evaluate the performance of machine learning algorithms in predicting mental health distress among university students in Tharaka Nithi County, Kenya. Data were collected using a structured questionnaire divided into three sections: demographic information, risk factors for mental distress, and psychological distress measured using the Kessler K-6 scale. A stratified random sampling technique based on the year of study was used to ensure proportional representation, guided by Cochran’s formula to achieve a sample size of 1,536. Ultimately, 1,128 students responded, yielding a 73.5% response rate. While 408 did not respond or partially completed the questionnaire, non-response bias was considered minimal as preliminary comparisons showed no significant differences in key demographic characteristics between respondents and non-respondents. Ethical approval was obtained from the Institutional Research Ethics Committee of Chuka University (Ref: NACOSTI/NBC/AC-0812), and all participants were provided with informed consent before participation, with the option to withdraw at any time without consequence. Table 1 below shows the definition of the study variables and their measurements.
Table 1. Variable Definition and their Measurements.

Features

Description

Measurement

Demographic Information

Age

The age category of the student respondent.

Categorical: 1 = 18–20 years, 2 = 21–23 years, 3 = 24–26 years, 4 = Above 26 years

Gender

The gender of the student respondent.

Categorical: 0 = Female, 1 = Male

Year of Study

The current academic year of the student.

Categorical: 1 = First Year, 2 = Second Year, 3 = Third Year, 4 = Fourth Year, 5 = Fifth Year

Faculty

The academic faculty or school to which the student belongs.

Categorical: 1 = Business, 2 = Education, 3 = Environmental Studies, 4 = Engineering, 5 = Science & Technology, 6 = Humanities, 7 = Law, 8 = Nursing

Relationship Status

The student’s current romantic relationship status.

Categorical: 1 = Single, 2 = Single & Searching, 3 = In a Relationship, 4 = Married

Residence

The student’s place of residence relative to the university.

Categorical: 1 = Within the School, 2 = Outside the School

Risk Factors for Mental Health Distress

Academic Pressure

Stress and anxiety are related to academic workload, performance expectations, and fear of failure.

5-point Likert scale (1 = Strongly Disagree to 5 = Strongly Agree)

Financial Stress

Worry and anxiety related to tuition fees, living expenses, and student debt.

5-point Likert scale (1 = Strongly Disagree to 5 = Strongly Agree)

Social and Environmental Factors

Effects of peer relationships, isolation, and discrimination on mental well-being.

5-point Likert scale (1 = Strongly Disagree to 5 = Strongly Agree)

Personal and Family Issues

Stress due to family expectations, romantic relationship problems, and conflicts.

5-point Likert scale (1 = Strongly Disagree to 5 = Strongly Agree)

Lifestyle and Health Factors

Impact of poor sleep, substance use, and neglect of physical health.

5-point Likert scale (1 = Strongly Disagree to 5 = Strongly Agree)

Transition to University Life

Stress in adapting to a new environment, independence, and routines.

5-point Likert scale (1 = Strongly Disagree to 5 = Strongly Agree)

Cultural Identity Factors

Stress from cultural adjustment, discrimination, and balancing beliefs.

5-point Likert scale (1 = Strongly Disagree to 5 = Strongly Agree)

Technology and Social Media Use

Negative effects of excessive social media use and online image pressure.

5-point Likert scale (1 = Strongly Disagree to 5 = Strongly Agree)

Personal and Mental Health

Influence of chronic illness, weight changes, and stress symptoms.

5-point Likert scale (1 = Strongly Disagree to 5 = Strongly Agree)

Quarter-Life Crisis

Anxiety about future uncertainty, milestones, and expectations.

5-point Likert scale (1 = Strongly Disagree to 5 = Strongly Agree)

Outcome Variable

Mental Health Distress

Overall psychological distress over the past 30 days.

Derived from Kessler Psychological Distress Scale (K-6): Low (0–4), Moderate (5–12), High (13–24)

Data were collected over two months using print and electronic formats like Google Forms. Participants were informed of confidentiality and voluntary participation; the average survey completion time was ten minutes. The approach provided a rich, representative dataset for training and evaluating predictive models of mental health distress based on demographic, social, academic, and psychological variables.
2.3. Validity and Reliability Analysis
University supervisors ensured Content validity through expert review, while reliability was tested using the Test-Retest method, with Pearson’s correlation coefficient computed using R software. Cronbach’s alpha of ≥0.70 was considered acceptable. Consider Table 2 below for reliability analysis.
Table 2. Reliability Analysis.

Variable

Raw Alpha

Std Alpha

G6 (SMC)

Average r

S/N

alpha se

Var r

Med r

Academic Pressure

0.888

0.888

0.91

0.216

7.981

0.005

0.008

0.215

Financial Stress

0.889

0.89

0.91

0.217

8.044

0.005

0.009

0.217

Social Environment

0.887

0.888

0.91

0.214

7.896

0.005

0.009

0.214

Personal and Family Issues

0.886

0.886

0.909

0.212

7.81

0.005

0.008

0.211

Lifestyle and Health Factors

0.887

0.888

0.91

0.214

7.902

0.005

0.008

0.212

Transition to University Life

0.887

0.888

0.909

0.214

7.884

0.005

0.008

0.214

Cultural Identity

0.887

0.888

0.91

0.214

7.904

0.005

0.008

0.214

Technology and social media

0.886

0.887

0.909

0.213

7.832

0.005

0.008

0.212

Personal Health Challenges

0.887

0.887

0.91

0.213

7.857

0.005

0.008

0.213

Quarter Life Crisis

0.887

0.888

0.91

0.215

7.936

0.005

0.008

0.214

Mean Score

0.891

0.891

0.913

0.214

8.177

0.005

2.543

0.635

Reliability analysis confirmed high internal consistency across all constructs, with Cronbach’s alpha values ranging from 0.886 to 0.891, well above the acceptable threshold of 0.70. The mean inter-item correlation (average r = 0.214) and Spearman-Brown coefficient (G6 [SMC] ≈ 0.91) further support scale coherence. Signal-to-noise ratios exceeded 7.8 for all domains, indicating robust reliability. The “Quarter-Life Crisis” and “Financial Stress” scales showed marginally higher alpha values (0.888 and 0.890, respectively), while the overall mean alpha was 0.891, confirming the questionnaire’s suitability for assessing multidimensional mental health risk factors among university students.
2.4. Data Preprocessing
The data preprocessing step is critical because it prepares the data for machine learning modelling. Data preprocessing includes cleaning, transformation, organization, imputation, and labelling. Checking for zero variance in the predictor was another critical data preprocessing step taken in this study. This step makes it possible to eliminate the features with zero variance since they were insignificant in predicting mental health distress. Data encoding was necessary for some variables where the dependent variable, mental health distress levels, was encoded as Low, Moderate, and High for analysis.
2.5. Data Partitioning
Data partitioning involves splitting data into training, testing, and validation sets . In this study, the training set comprised 70% of the entire data set, with the testing set making up 30% (Table 3). The rationale for splitting data into 70% for training and 30% for testing (or sometimes 80%/20%) is based on balancing model learning and evaluation. The training set (70%) comprises most of the data used to train the machine learning model. A larger training set allows the model to learn patterns and relationships in the data more effectively, improving model performance. On the other hand, the testing set (30%) evaluates the model’s performance on unseen data. A 30% split ensures enough data is available to assess the model’s generalizability and avoid overfitting.
Table 3. Data Partitioning into Training and Testing Sets.

Sample

Distress

Total

High

Low

Moderate

Test

30

106

201

337

8.9%

31.5%

59.6%

100%

30%

29.8%

29.9%

29.9%

Train

70

250

471

791

8.8%

31.6%

59.5%

100%

70%

70.2%

70.1%

70.1%

Total

100

356

672

1128

8.9%

31.6%

59.6%

100%

100%

100%

100%

100%

χ2=0.003; · df=2; · Cramer's V=0.002; · p=0.999
Table 2 shows a chi-square test of independence conducted to examine the relationship between data partitioning (training vs. testing) and levels of mental health distress (low, moderate, high) among 1,128 university students. The results showed no significant association between sample type and distress levels, χ2(2, N = 1128) = 0.003, p =.999, with a negligible effect size (Cramer’s V = 0.002). Distress levels were similarly distributed across training (70.1%) and testing (29.9%) sets: 8.8–8.9% high, 31.5–31.6% low, and 59.5–59.6% moderate. This indicates that the data split preserved the original mental health distress categories distribution.
2.6. Testing Proportionality of the Cases
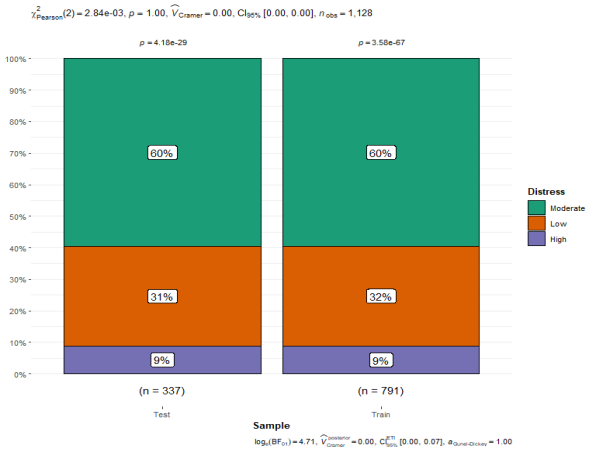
Figure 1 compares the distribution of “Distress” levels (High, Low, Moderate) between “Test” and “Train” samples. The “Test” sample (n=337) and “Train” sample (n=791) show remarkably similar proportions. In both samples, 60% of individuals experience Moderate distress, 31-32% experience Low distress, and 9% experience High distress. Pearson’s chi-squared test shows a very low chi-squared value and a high p-value (p=1.00), indicating no significant difference in the distribution of distress between the two samples. The Cramer’s V value is 0.00, confirming no association. The Bayes Factor (log10(BF01)=4.71) strongly supports the null hypothesis of no difference in the distribution of distress cases between the two samples.
Figure 1. Testing Proportionality of the Cases in the Training and Testing Set.
2.7. Models Development Process
2.7.1. Random Forest
Let the dataset be defined as D={xi,yi}i=1N, where xi=xi1,xi2,...,xipRp denotes the predictor variables (e.g., demographic, academic, and psychosocial factors), and yi{1,2,3} represents the distress levels: 1 = Low, 2 = Moderate, 3 = High. The RF model builds B decision trees, each trained on a bootstrap sample DbD drawn with replacement. For each split in a tree, a random subset of mp features is selected. The optimal split is determined by minimizing an impurity measure such as the Gini Index:
Gt=1-k=1Kpk2t(1)
where pkt is the proportion of observations of class k in node t, and K=3 for the three-class distress outcome.
At each internal node t of a tree, the algorithm searches for a feature xjFm{x1,x2,...,xp} and split point s that minimizes the weighted impurity:
ΔG=Gt-NLNtGtL+NRNtGtR(2)
where tL and tR are the child nodes, and Nt,NL,NR are the number of samples in the parent and child nodes, respectively.
After training B trees, the ensemble prediction for a new observation x is obtained by majority voting:
ŷ=argmaxk{1,2,3}b=1BITbx=k(3)
where Tb denotes the bth tree and I is the indicator function.
Hyperparameter tuning is carried out using grid search with stratified k-fold cross-validation (commonly k=10), optimizing a metric M, such as overall accuracy, macro-averaged F1-score, or Cohen’s Kappa:
θ*=argmaxθΘ1ki=1kMŷi,yi(4)
where θ includes parameters such as the number of trees B, maximum depth, and minimum samples per leaf.
Variable importance is calculated using the Mean Decrease in Gini or Permutation Importance to assess feature relevance. Let the overall importance of the variable xj be denoted as:
Impxj=1Bb=1BtTbΔGtIsplit on xj(5)
Class imbalance present in psychological datasets was addressed using the Synthetic Minority Over-sampling Technique (SMOTE). Shapley Additive Explanations (SHAP) values are employed to improve model transparency. Given a model f and an input x, the SHAP value ϕj quantifies the contribution of feature j to the prediction:
fx=ϕ0+j=1pϕj(6)
where ϕ0 is the base value (mean prediction), and the ϕj are computed using cooperative game theory. Finally, model performance was evaluated on a held-out test set using multi-class metrics, including:
Accuracy:1Ni=1NIŷi=yi(7)
Precision, Recall, F1-score for each class k, and their macro-averages.
Cohen’s Kappa: Adjusts for chance agreement.
κ=po-pe1-pe(8)
where po is observed agreement and pe is expected agreement by chance.
This formulation enables robust and interpretable classification of mental health distress levels, aligning well with the need for accurate, data-driven mental health screening among university students.
2.7.2. Extreme Gradient Boosting
Let the training data be D={xi,yi}i=1n, where:
xiRp is the feature vector for the ith student,
yi{0,1,2} corresponds to Low, Moderate, and High distress levels,
K=3 is the number of classes.
The XGBoost model builds an additive prediction function:
ŷit=ŷit-1+ftxi(9)
where ftF represents the tth regression tree in the ensemble, and F is the space of classification trees:
F=fx=wqx,q:Rp{1,...,T},wRT(10)
Each ft maps the input to a leaf index, and w assigns weights to the leaves.
Objective Function
The regularized objective function for multi-class classification is:
Lt=i=1nlyi,ŷit-1+ftxi+Ωft(11)
where l is the softmax loss:
lyi,ŷi=-k=1KIyi=klogexpŷikj=1Kexpŷij(12)
and Ωf=γT+12λj=1Twj2 is a regularization term penalizing tree complexity (number of leaves T) and leaf weights wj, with γ and λ as tuning parameters.
Gradient Boosting Procedure
To optimize the objective, the model uses a second-order Taylor approximation:
Lti=1ngiftxi+12hiftxi2+Ωft(13)
where:
gi=lyi,ŷiŷi is the first derivative (Gradient),
hi=2lyi,ŷiŷi2 is the second derivative (Hessian).
The tree is constructed by selecting the best split that maximizes the gain:
Gain=12GL2HL+λ+GR2HR+λ-GL+GR2HL+HR+λ-γ(14)
Where GL,HL and GR,HR are the summed gradients and
Hessians for the left and right nodes, respectively
Prediction and Classification
After training T trees, the predicted raw score vector for class k is:
ŷik=t=1Tftkxi(15)
The predicted class is the one with the highest SoftMax probability:
ĉi=argmaxkexpŷikj=1Kexpŷij(16)
3. Results and Discussion
3.1. Chi-Square Test of Independence
3.1.1. Demographic Factors
A Chi-square test of independence was conducted to examine the association between demographic characteristics and levels of mental health distress (High, Moderate, and Low) among 11,283 participants (Table 4). The analysis revealed a statistically significant association between age and mental health distress levels, χ2(6, N = 11,283) = 99.47, p < 0.001. Among individuals aged 18–20 years, 16% experienced high distress (95% CI: 9.7%, 25%), 34% had low distress (95% CI: 29%, 39%), and 18% had moderate distress (95% CI: 16%, 22%). Participants aged 24–26 years reported the highest percentage in the high distress category at 36% (95% CI: 27%, 46%), compared to 25% in the low distress group (95% CI: 20%, 30%) and 29% in the moderate group (95% CI: 26%, 33%). Gender was not significantly associated with mental health distress levels, χ2(2, N = 11,283) = 4.10, p = 0.13. Females accounted for 56% of those with high distress (95% CI: 46%, 66%) and 45% of those with low distress (95% CI: 40%, 50%). Relationship status showed a significant association, χ2(6, N = 11,283) = 64.98, p < 0.001. High distress was more common among married individuals (24%, 95% CI: 16%, 34%) than 9% in the low distress group (95% CI: 6.3%, 13%). Residence was also significantly related to distress, χ2(2, N = 11,283) = 47.85, p < 0.001. Among those experiencing high distress, 68% resided outside the school (95% CI: 58%, 77%), compared to 51% in the low distress group (95% CI: 45%, 56%) and 69% in the moderate group (95% CI: 65%, 72%). These findings indicate that age, relationship status, and residence are significantly associated with mental health distress levels, while gender is not.
Table 4. Chi-Square Test of Independence of Demographic Factors and Mental Health Distress.

Characteristic

High

95% CI

Low

95% CI

Moderate

95% CI

p-value2

N = 1001

N = 3561

N = 6721

Age

<0.001

18-20 years

16 (16%)

9.7%, 25%

120 (34%)

29%, 39%

124 (18%)

16%, 22%

21-23 years

32 (32%)

23%, 42%

132 (37%)

32%, 42%

276 (41%)

37%, 45%

24-26 years

36 (36%)

27%, 46%

88 (25%)

20%, 30%

196 (29%)

26%, 33%

above 26 years

16 (16%)

9.7%, 25%

16 (4.5%)

2.7%, 7.3%

76 (11%)

9.1%, 14%

Gender

0.13

Female

56 (56%)

46%, 66%

160 (45%)

40%, 50%

308 (46%)

42%, 50%

Male

44 (44%)

34%, 54%

196 (55%)

50%, 60%

364 (54%)

50%, 58%

Relationship

<0.001

Single

32 (32%)

23%, 42%

184 (52%)

46%, 57%

256 (38%)

34%, 42%

Single and searching

20 (20%)

13%, 29%

64 (18%)

14%, 22%

132 (20%)

17%, 23%

In a relationship

24 (24%)

16%, 34%

76 (21%)

17%, 26%

184 (27%)

24%, 31%

Married

24 (24%)

16%, 34%

32 (9.0%)

6.3%, 13%

100 (15%)

12%, 18%

Residence

<0.001

Within the School

32 (32%)

23%, 42%

176 (49%)

44%, 55%

208 (31%)

28%, 35%

Outside the School

68 (68%)

58%, 77%

180 (51%)

45%, 56%

464 (69%)

65%, 72%

3.1.2. Mental Health Risk Factors
The analysis of mental health distress levels with the associated risk factors revealed significant associations with year of study and faculty, with both variables yielding p-values less than 0.001, indicating strong statistical significance (Table 5). First-year students reported the highest proportion of high distress at 12% (95% CI: 6.6%, 20%), followed by fifth-year students at 20% (95% CI: 13%, 29%), whereas third-year students were more represented in the moderate distress category at 29% (95% CI: 25%, 32%). Notably, second-year students constituted 26% (95% CI: 21%, 31%) of those with low distress. Faculty-wise, students from the Faculty of Science and Technology recorded the highest proportion in the high distress group at 24% (95% CI: 16%, 34%), followed closely by those from the Faculty of Education (20%; 95% CI: 13%, 29%) and Engineering (16%; 95% CI: 9.7%, 25%). Conversely, high distress was absent among students from the Faculty of Humanities. Students from the Faculty of Business had a lower proportion in the high distress category (8.0%; 95% CI: 3.8%, 16%) but were more represented in the low and moderate categories. These findings suggest that both academic stage and disciplinary context are significant risk factors influencing the likelihood of experiencing mental distress among university students.
Table 5. Chi-Square Test of Independence of Demographic Factors and Mental Health Distress.

Characteristic

High

95% CI

Low

95% CI

Moderate

95% CI

p-value2

N = 1001

N = 3561

N = 6721

Year of Study

<0.001

First Year

12 (12%)

6.6%, 20%

116 (33%)

28%, 38%

72 (11%)

8.5%, 13%

Second Year

24 (24%)

16%, 34%

92 (26%)

21%, 31%

192 (29%)

25%, 32%

Third Year

16 (16%)

9.7%, 25%

60 (17%)

13%, 21%

192 (29%)

25%, 32%

Fourth Year

28 (28%)

20%, 38%

64 (18%)

14%, 22%

128 (19%)

16%, 22%

Fifth Year

20 (20%)

13%, 29%

24 (6.7%)

4.5%, 10%

88 (13%)

11%, 16%

Faculty

<0.001

Business

8 (8.0%)

3.8%, 16%

76 (21%)

17%, 26%

132 (20%)

17%, 23%

Education

20 (20%)

13%, 29%

32 (9.0%)

6.3%, 13%

136 (20%)

17%, 24%

Environmental Studies

4 (4.0%)

1.3%, 11%

60 (17%)

13%, 21%

80 (12%)

9.6%, 15%

Engineering

16 (16%)

9.7%, 25%

24 (6.7%)

4.5%, 10%

76 (11%)

9.1%, 14%

Science and Technology

24 (24%)

16%, 34%

72 (20%)

16%, 25%

108 (16%)

13%, 19%

Humanities

0 (0%)

0.00%, 4.6%

32 (9.0%)

6.3%, 13%

48 (7.1%)

5.4%, 9.4%

Law

16 (16%)

9.7%, 25%

12 (3.4%)

1.8%, 6.0%

36 (5.4%)

3.8%, 7.4%

Nursing

12 (12%)

6.6%, 20%

48 (13%)

10%, 18%

56 (8.3%)

6.4%, 11%

3.2. Ensemble Learning Summary and Performance
This study used Random Forest (RF) and Extreme Gradient Boosting (XGBoost) as representative ensemble models. The performance of the models was assessed using the best tune presented in Tables 6 and 7 below.
Table 6. Determination of the Best Tune for the Random Forest Model.

MTRY

Accuracy

Kappa

Accuracy SD

Kappa SD

2

0.9751266

0.9527738

0.02166036

0.04158184

3

0.982711

0.9673928

0.01864756

0.03522363

5

0.9848207

0.9714572

0.01977287

0.03705547

6

0.9848207

0.9714572

0.01977287

0.03705547

8

0.9839768

0.9699281

0.02126335

0.03972384

9

0.9839768

0.9699281

0.02126335

0.03972384

11

0.9835549

0.9691574

0.0213198

0.03981973

12

0.982711

0.9676212

0.02216725

0.04131741

14

0.982711

0.9676212

0.02216725

0.04131741

16

0.9839768

0.9699281

0.02126335

0.03972384

Table 4 presents hyper-parameter tuning results for the Random Forest model, evaluating `mtry` (number of predictors sampled at each split). Optimal performance occurred at `mtry=5` and `mtry=6`, yielding peak mean accuracy (98.48%) and Cohen’s Kappa (0.9715), indicating near-perfect agreement. Higher `mtry` values showed marginal performance decline. Low standard deviations (Accuracy SD ≤ 0.022, Kappa SD ≤ 0.042) across folds suggest model stability, confirming `mtry=5` as ideal for balancing predictive power and generalizability in mental distress classification.
Table 7. Determination of the Best Tune for the Extreme Gradient Model.

ETA

Max Depth

Gamma

Col-sample by Tree

Min child weight

Subsample

N rounds

Accuracy

Kappa

Accuracy SD

Kappa SD

0.300

3.000

0.000

0.600

1.000

0.750

150.000

0.987

0.977

0.012

0.022

0.400

3.000

0.000

0.600

1.000

0.500

150.000

0.987

0.976

0.015

0.027

0.300

3.000

0.000

0.800

1.000

0.750

150.000

0.986

0.974

0.014

0.026

0.400

3.000

0.000

0.600

1.000

0.750

150.000

0.986

0.974

0.014

0.026

0.400

3.000

0.000

0.600

1.000

1.000

150.000

0.986

0.974

0.014

0.026

0.400

3.000

0.000

0.800

1.000

0.500

150.000

0.985

0.972

0.014

0.027

0.300

3.000

0.000

0.800

1.000

1.000

150.000

0.984

0.969

0.016

0.030

0.400

3.000

0.000

0.800

1.000

0.750

150.000

0.982

0.967

0.016

0.030

0.400

3.000

0.000

0.800

1.000

1.000

150.000

0.982

0.967

0.016

0.030

0.400

3.000

0.000

0.600

1.000

0.500

100.000

0.981

0.964

0.014

0.026

Table 6 details hyper-parameter tuning for the XGBoost model using 10-fold cross-validation. The optimal configuration (ETA=0.3, Max Depth=3, Subsample=0.75, Colsample=0.6, N_rounds=150) achieved peak mean accuracy (98.7%) and Kappa (0.977), with the lowest variability (Accuracy SD=0.012, Kappa SD=0.022). Performance declined with higher ETA (0.4), reduced subsampling (0.5), or fewer boosting rounds (100). This confirms that careful tuning of learning rate and sampling parameters is critical for maximizing predictive stability and performance in mental health risk stratification.
Model performance was rigorously evaluated using standard classification metrics, as summarized in Tables 8 and 9 below.
Table 8. Ensemble Learning Summary.

Metrics

Random Forest

Extreme Gradient Boosting

Accuracy

0.988

0.988

95% Confidence Interval

(0.969, 0.997)

(0.969, 0.997)

No Information Rate

0.596

0.596

P-Value (Acc > NIR)

< 2.2e-16

< 2.2e-16

Kappa

0.978

0.978

McNemar’s Test P-Value

NA

NA

Table 7 shows the summaries for the ensemble models, Random Forest and Extreme Gradient Boosting, demonstrating a strong and identical performance in predicting mental health distress levels among university students. Both models achieved an accuracy of 98.8%, with a 95% confidence interval ranging from 96.9% to 99.7%. The No Information Rate (NIR) was 0.596, and the p-value for accuracy exceeding the NIR was less than 2.2e-16, indicating a statistically significant improvement over baseline classification. The kappa statistic was 0.978 for both models, reflecting near-perfect agreement beyond chance. McNemar’s test was not applicable in this context. Overall, the ensemble models proved to be highly effective and reliable.
Table 9. Ensemble Learning Performance Metrics.

Metrics

Random Forest Model

XGBoost

High

Low

Moderate

High

Low

Moderate

Sensitivity

1.000

1.000

0.980

1.000

1.000

0.980

Specificity

1.000

0.983

1.000

1.000

0.983

1.000

PPV

1.000

0.964

1.000

1.000

0.964

1.000

NPV

1.000

1.000

0.971

1.000

1.000

0.971

Precision

1.000

0.964

1.000

NA

NA

NA

Recall

1.000

1.000

0.980

NA

NA

NA

F1 Score

1.000

0.982

0.990

NA

NA

NA

Prevalence

0.089

0.315

0.596

0.089

0.315

0.596

DR

0.089

0.315

0.585

0.089

0.315

0.585

DP

0.089

0.326

0.585

0.089

0.326

0.585

BA

1.000

0.991

0.990

1.000

0.991

0.990

AUC

1.000

1.000

1.000

1.000

0.997

0.998

The performance metrics for Random Forest and XGBoost models indicate exceptional classification ability across all classes of mental health distress: High, Low, and Moderate. Both models achieved perfect sensitivity (1.000) and specificity (≥ 0.983) across most categories (Table 8). Random Forest attained perfect positive predictive value (PPV) and negative predictive value (NPV) for High and Moderate categories, with NPV for Moderate at 0.971. Precision, recall, and F1 scores were consistently high for Random Forest, with F1 scores of 1.000, 0.982, and 0.990 for High, Low, and Moderate, respectively. Balanced Accuracy (BA) was near perfect across classes (≥ 0.990). The area under the curve (AUC) values were also high, with Random Forest yielding 1.000 across all classes. XGBoost achieved 1.000, 0.997, and 0.998 for High, Low, and Moderate, respectively, confirming excellent discriminatory power.
3.3. Explainable Artificial Intelligence
Explainable Artificial Intelligence (XAI) enhances transparency and trust in machine learning models by providing clear insights into how predictions are made. This study applied XAI techniques from the DALEX package in the R-programming language to interpret feature importance and decision pathways, supporting informed interventions in predicting mental health distress among university students
3.3.1. Features Importance Plot
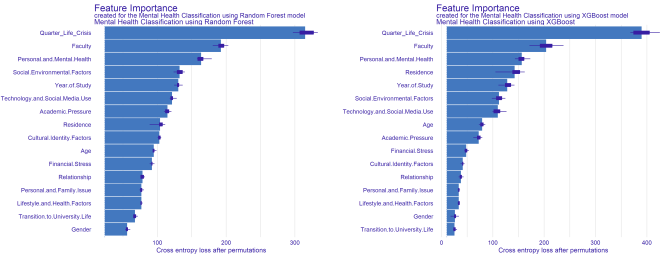
Figure 2. Features Importance Plot for Random Forest and XGBoost.
Figure 2 shows the importance of features for a mental health classification model, for the Random Forest and XGBoost algorithms. The Random Forest model shows “Quarter Life Crisis” as the most important feature with a cross-entropy loss of approximately 320, followed by “Faculty” at around 180, and “Personal and Mental Health” at about 160. “Social Environmental Factors” and “Year of Study” follow, with losses of around 120 and 100, respectively. All other features have importance values below 100, with “Gender” and “Transition to University Life” being the least important. The XGBoost model, on the other hand, yields similar results but with higher importance scores. “Quarter Life Crisis” is again the most important feature, with a cross-entropy loss of approximately 420. “Faculty” and “Personal and Mental Health” follow with about 220 and 190 losses. “Residence,” “Year of Study,” and “Social Environmental Factors” have scores between 100 and 150. “Gender” and “Transition to University Life” are once again the least important features, with scores below 50. The error bars on both plots indicate the variability in the importance scores. Overall, both models identify “Quarter Life Crisis,” “Faculty,” and “Personal and Mental Health” as the most critical features for predicting mental health outcomes.
3.3.2. Model Breakdown
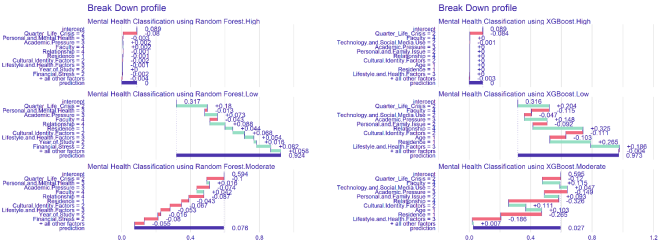
Figure 3 shows the ensemble learning breakdown profile detailing the contributions of various features to mental health classification models, for Random Forest and XGBoost, across “High,” “Low,” and “Moderate” mental health categories. For the Random Forest “High” class, the prediction is 0.0001, with “Quarter Life Crisis” having a negative contribution of -0.08 and “Personal and Mental Health” a positive contribution of +0.038. The XGBoost “High” model is similar, predicting 0.0001, with “Quarter Life Crisis” contributing -0.084 and “Academic Pressure” contributing +0.034.
The Random Forest “Low” class predicts 0.924, heavily influenced by an intercept of 0.317 and “Quarter Life Crisis,” which adds a substantial +0.18. Other positive contributors include “Personal and Mental Health” (+0.073) and “Academic Pressure” (+0.054). The XGBoost “Low” class, predicting 0.973, also has a high intercept of 0.316 and sees “Quarter Life Crisis” as the primary positive contributor (+0.204), followed by “Faculty” (+0.148) and “Personal and Family Issue” (+0.111).
For the Random Forest “Moderate” class, the prediction is 0.076, with the intercept at 0.594, but a large negative contribution from “Quarter Life Crisis” (-0.559). The XGBoost “Moderate” class predicts 0.027, with the intercept at 0.403 and a significant negative contribution from “Quarter Life Crisis” (-0.186), showing its strong influence in all classifications. These plots demonstrate how feature contributions shift dramatically based on the predicted class and the model used.
Figure 3. Ensemble Learning Breakdown Profile.
3.3.3. Shapley Additive Explanations
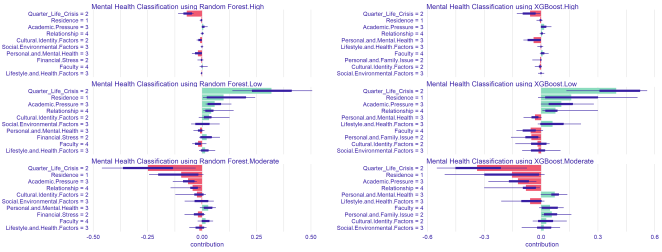
Figure 4 illustrates feature contributions to a mental health classification for Random Forest and XGBoost algorithms, for “High,” “Low,” and “Moderate” mental health outcomes. The x-axis represents the contribution of each feature to the model’s prediction, with positive values pushing the prediction towards a higher class and negative values pushing it lower. The “High” mental health plots for both models show minimal feature contributions, with “Quarter Life Crisis” having a small negative impact and “Academic Pressure” a small positive one. Both models in the “Low” mental health classes show “Quarter Life Crisis” as a major positive contributor, contributing approximately 0.25 in the Random Forest model and about 0.35 in the XGBoost model. “Residence” and “Academic Pressure” also contribute positively. Conversely, the “Moderate” mental health classes highlight “Quarter Life Crisis” as a dominant negative contributor, with a contribution of around -0.3 in the Random Forest model and -0.25 in the XGBoost model. “Residence” and “Academic Pressure” also show negative contributions to mental health distress. The plots effectively demonstrate how the same features can have vastly different impacts on the prediction depending on the mental health outcome under classification.
Figure 4. SHapley Additive Explanations for Random Forest and XGBoost Models.
4. Discussion
This study demonstrates that transparent ensemble machine learning models, Random Forest and XGBoost, achieve exceptional performance in predicting multi-level mental health distress (low, moderate, high) among Kenyan university students, with accuracy exceeding 98.7%, Cohen’s Kappa >0.976, and near-perfect class-specific precision, recall, and F1-scores. These results significantly outperform prior binary classification approaches and align with recent ensemble-based mental health studies reporting high accuracy in Western contexts . The dominance of “Quarter-Life Crisis” (QLC), manifested through confusion about life direction, emotional exhaustion, and dissatisfaction with academic progress, as the top predictor, corroborates developmental theories identifying early adulthood as a period of heightened identity and existential vulnerability . Notably, students in high-demand faculties (e.g., Science, Engineering, Nursing) exhibited elevated distress, consistent with global evidence linking academic intensity to burnout . Financial stressors (e.g., inability to afford meals or materials) and off-campus residence further reflect structural inequities documented in sub-Saharan African student populations . Integrating SHAP and feature importance analyses enhances model interpretability, addressing growing calls for ethical, explainable AI in sensitive health domains . Unlike “black-box” models, our approach reveals what predicts distress and why, enabling targeted interventions: for instance, embedding career counseling within STEM curricula or expanding emergency financial aid. The near-perfect sensitivity (100%) and specificity (>98%) for high-distress cases underscore the model’s clinical utility for early screening. However, the cross-sectional design limits causal inference, a key limitation acknowledged in similar studies . Future work should employ longitudinal designs to assess how QLC trajectories and academic stressors evolve over time and whether AI-triggered interventions improve outcomes. Ultimately, this study advances methodological rigor and contextual relevance, offering a scalable, transparent framework for mental health risk prediction in under-resourced university settings across Africa.
5. Conclusion
This study demonstrates that transparent ensemble machine learning models, Random Forest and XGBoost, achieve exceptional performance in predicting multi-level mental health distress (low, moderate, high) among university students in Kenya, with accuracy exceeding 98.7%, near-perfect Cohen’s Kappa (>0.976), and class-specific F1-scores above 98.5%. The dominance of Quarter-Life Crisis (QLC) variables, particularly emotional exhaustion, identity confusion, and academic dissatisfaction, as top predictors underscores the developmental vulnerability of early adulthood in this context. Additional key risk factors include enrollment in high-demand faculties (e.g., Science, Engineering, Nursing), financial hardship, off-campus residence, and limited access to mental health support. These findings validate the utility of explainable AI for high-accuracy risk stratification and for uncovering context-specific psychosocial determinants. The models’ robustness and interpretability position them as viable tools for scalable, early-warning systems in resource-constrained university settings across sub-Saharan Africa.
6. Recommendations
University administrations should integrate these AI-driven models into student wellness platforms for real-time mental health screening and early intervention. Counseling services must be tailored to address QLC-related challenges, including identity exploration and future anxiety, particularly in high-risk faculties. Financial aid programs should be expanded to mitigate socioeconomic stressors linked to distress. Furthermore, institutional policies should prioritize mental health literacy, reduce stigma, and strengthen referral pathways. Future research should employ longitudinal designs to validate model predictions over time and evaluate the clinical and academic impact of AI-triggered interventions on student well-being and retention.
Abbreviation

QLC

Quarter Life Crisis

RF

Random Forest

XGBoost

Extreme Gradient Boosting

SMOTE

Synthetic Minority Over-sampling Technique

SHAP

SHapley Additive exPlanations

AUC

Area Under the Curve

CI

Confidence Interval

NIR

No Information Rate

PPV

Positive Predictive Value

NPV

Negative Predictive Value

Acknowledgments
The authors sincerely acknowledge the support and cooperation of the students from Chuka University and Tharaka University who participated in this study. We are grateful to the Chuka university administration for providing conducive enviroment to conduct the research. Special thanks go to the Department of Physical Science and the Department of Social Sciences, Chuka University, for their academic and logistical support. We also thank the Center for Data Analytics and Modeling (CDMA), Chuka University, for providing access to the technical support needed in this research. We also appreciate the insightful feedback from peer reviewers that enhanced the quality of this work. This research was self-funded, and we acknowledge all individuals’ commitment to its successful completion.
Author Contributions
Victor Wandera Lumumba: Conceptualization, Data curation, Formal Analysis, Methodology, writing – original draft, Writing – review & editing
Dennis Kariuki Muriithi: Conceptualization, Data curation, Formal Analysis, Methodology, writing – original draft, Writing – review & editing
Monica Oundo: Conceptualization, Data curation, Formal Analysis, Methodology, writing – original draft, Writing – review & editing
Funding
The research received no external funding.
Data Availability Statement
The data is available from the corresponding author upon reasonable request.
Conflicts of Interest
The authors declare no conflicts of interest.
References
[1] Van de Velde, S., Buffel, V., van der Heijde, C., Çoksan, S., Bracke, P., Abel, T., Busse, H., Zeeb, H., Rabiee-khan, F., Stathopoulou, T., Van Hal, G., Ladner, J., Tavolacci, M., Tholen, R., & Wouters, E. (2021). Depressive symptoms in higher education students during the first wave of the COVID-19 pandemic. An examination of the association with various social risk factors across multiple high- and middle-income countries. SSM - Population Health, 16, 100936.
[2] Caldarelli, G., Pizzini, B., Cosenza, M., & Troncone, A. (2024). The prevalence of mental health conditions and effectiveness of psychological interventions among university students in Italy: A systematic literature review. Psychiatry Research, 342, 116208–116208.
[3] World Health Organization. (2022, March 2). COVID-19 pandemic triggers 25% increase in prevalence of anxiety and depression worldwide. World Health Organization; World Health Organization.
[4] Chang, J.-J., Ji, Y., Li, Y.-H., Pan, H.-F., & Su, P.-Y. (2021). Prevalence of anxiety symptoms and depressive symptoms among college students during the COVID-19 pandemic: A meta-analysis. Journal of Affective Disorders, 292, 242–254.
[5] Beiter, R., Nash, R., McCrady, M., Rhoades, D., Linscomb, M., Clarahan, M., & Sammut, S. (2015). The prevalence and correlates of depression, anxiety, and stress in a sample of college students. Journal of Affective Disorders, 173(1), 90–96.
[6] Hill, M., Farrelly, N., Clarke, C., & Cannon, M. (2020). Student mental health and well-being: Overview and Future Directions. Irish Journal of Psychological Medicine, 41(2), 1–8.
[7] Shatte, A. B. R., Hutchinson, D. M., & Teague, S. J. (2019). Machine learning in mental health: a scoping review of methods and applications. Psychological Medicine, 49(09), 1426–1448.
[8] Lumumba, V., Muriithi, D., & Oundo, M. (2025). Evaluating the Performance of Selected Single Classifiers with Incorporated Explainable Artificial Intelligence (XAI) in the Prediction of Mental Health Distress Among University Students. American Journal of Artificial Intelligence, 9(2), 133–144.
[9] Muriithi, D. K., Lumumba, V. W., Awe, O. O., & Muriithi, D. M. (2025). An Explainable Artificial Intelligence Models for Predicting Malaria Risk in Kenya. European Journal of Artificial Intelligence and Machine Learning, 4(1), 1–8.
[10] Rane, N., Choudhary, S., & Rane, J. (2024). Ensemble Deep Learning and Machine Learning: Applications, Opportunities, Challenges, and Future Directions. Social Science Research Network.
[11] Zhao, S., Zhou, D., Wang, H., Chen, D., & Yu, L. (2025). Enhancing Student Academic Success Prediction Through Ensemble Learning and Image-Based Behavioral Data Transformation. Applied Sciences, 15(3), 1231–1231.
[12] Fatima, S., Hussain, A., Amir, S. B., Ahmed, S. H., & Syed. (2023). XGBoost and Random Forest Algorithms: An in Depth Analysis. Pakistan Journal of Scientific Research, 3(1), 26–31.
[13] Ku, W. L., & Min, H. (2024). Evaluating Machine Learning Stability in Predicting Depression and Anxiety Amidst Subjective Response Errors. Healthcare, 12(6), 625–625.
[14] Kruzan, K. P., Fitzsimmons-Craft, E. E., Dobias, M., Schleider, J. L., & Pratap, A. (2022). Developing, Deploying, and Evaluating Digital Mental Health Interventions in Spaces of Online Help- and Information-Seeking. Procedia Computer Science, 206, 6–22.
[15] Franken, K., Klooster, P. ten, Bohlmeijer, E., Westerhof, G., & Kraiss, J. (2023). Predicting non-improvement of symptoms in daily mental healthcare practice using routinely collected patient-level data: a machine learning approach. Frontiers in Psychiatry, 14.
[16] WHO. (2021, November 17). Mental health of adolescents. Who. int; World Health Organization: WHO.
[17] Mutie, C., Kyalo, I. W., Mulala, K. M., Njeri, K. L., & Mwenda, C. S. M. (2023, August 1). Determinants of Mental Distress Among University Students: A Narrative Review of Global, Regional, and Local Perspectives. Kenyan Journal of Nursing & Midwifery.
[18] Mugotitsa, B., Momanyi, R., Kuria, J., Amadi, D., Masai, J., Angula, E., Tsofa, B., Greenfield, J., Todd, J., & Kiragga, A. (2025). Understanding mental health among university students in Kenya: what role do family support and age play? Frontiers in Public Health, 13.
[19] Simões de Almeida, R., Rodrigues, A., Tavares, S., Barreto, J. F., Marques, A., & Trigueiro, M. J. (2025). Mental Health and Lifestyle Factors Among Higher Education Students: A Cross-Sectional Study. Behavioral Sciences, 15(3), 253.
[20] Njoroge, M., & Omondi, P. (2020). Cultural identity and mental health among Kenyan university students. Kenya Journal of Counseling and Psychotherapy, 24(4), 172-180.
[21] Yoon, E., Lee, R., & Goh, M. (2021). The role of cultural identity in mental health among university students. Journal of Counseling Psychology, 68(4), 479-490.
[22] Patel, V., Saxena, S., Lund, C., Thornicroft, G., Baingana, F., Bolton, P., Chisholm, D., Collins, P. Y., Cooper, J. L., Eaton, J., Herrman, H., Herzallah, M. M., Huang, Y., Jordans, M. J. D., Kleinman, A., Medina-Mora, M. E., Morgan, E., Niaz, U., Omigbodun, O., & Prince, M. (2018). The Lancet Commission on global mental health and sustainable development. The Lancet, 392(10157), 1553–1598.
[23] Thornicroft, G., Deb, T., & Henderson, C. (2016). Community mental health care worldwide: current status and further developments. World Psychiatry, 15(3), 276–286.
[24] Owomugisha, E., Atibuni, D. Z., & Olema, D. K. (2025). Challenges and Implications of Mental Health on Educational Outcomes in Sub-Saharan Africa. East African Journal of Education Studies, 8(3), 84–98.
[25] Oswalt, S. B., Lederer, A. M., & Day, C. (2020). Understanding student mental health in higher education: A review of key issues. Journal of College Student Psychotherapy, 34(2), 83-98.
[26] Tao, S., Dong, Q., & Zhao, X. (2021). Gender differences in student mental health. Journal of Behavioral Health, 10(3), 240-249.
[27] Kim, S. H., & Seo, J. (2021). The effects of academic stress on mental health among university students in East Asia. Educational Review, 73(3), 409-422.
[28] Li, J., Li, L., & Zhang, Y. (2021). Financial stress, student debt, and mental health. Journal of Financial Counseling and Planning, 32(1), 76-92.
[29] Hefner, J., & Eisenberg, D. (2020). Social support and mental health among college students. American Journal of College Health, 61(6), 348-356.
[30] Saleem, S., & Mahmood, Z. (2020). The effects of family expectations on student mental health. Journal of Family Psychology, 34(2), 189-202.
[31] Tripoli, G., Sofia Lo Duca, Ferraro, L., Zahid, U., Mineo, R., Seminerio, F., Bruno, A., Vanessa Di Giorgio, Maniaci, G., Marrazzo, G., Sartorio, C., Scaglione, A., Daniele La Barbera, & Caterina La Cascia. (2023). Lifestyles and Quality of Life of People with Mental Illness During the COVID-19 Pandemic. Community Mental Health Journal.
[32] Berryman, C., Ferguson, C. J., & Negy, C. (2021). Social media use and mental health. Journal of Youth and Adolescence, 49(6), 1217-1236.
[33] Roberts, C., & Chesney, T. (2021). The quarter-life crisis: A developmental perspective. Journal of Adolescent Research, 37(2), 105-120.
[34] Prochaska, J. J., Sung, H.-Y., Max, W., Shi, Y., & Ong, M. (2012). Validity study of the K6 scale as a measure of moderate mental distress based on mental health treatment need and utilization. International Journal of Methods in Psychiatric Research, 21(2), 88–97.
[35] Chen, Y., Zhang, X., Lu, L., Wang, Y., L iu, J., Qin, L., Ye, L., Zhu, J., Shia, B.-C., & Chen, M.-C. (2022). Machine Learning Methods to Identify Predictors of Psychological Distress. Processes, 10(5), 1030–1030.
[36] Chung, J., & Teo, J. (2023). Single classifier vs. ensemble machine learning approaches for mental health prediction. Brain Informatics, 10(1).
[37] Tahseen, S., & Danti, A. (2023). Classification of Psychological Disorders by Feature Ranking and Fusion using Gradient Boosting. International Journal of Advanced Computer Science and Applications/International Journal of Advanced Computer Science & Applications, 14(2).
[38] Alnuaimi, A. F. A. H., & Hasan, T. (2024, April 5). An overview of machine learning classification techniques. ResearchGate; EDP Sciences.
[39] Capili, B. (2021). Cross-Sectional Studies. The American Journal of Nursing/American Journal of Nursing, 121(10), 59–62.
Cite This Article
  • APA Style

    Lumumba, V. W., Muriithi, D. K., Oundo, M. (2026). A Transparent AI-Driven Ensemble Learning Approach for Predicting Mental Health Risks among University Students in Kenya. International Journal of Psychological and Brain Sciences, 11(2), 35-51. https://doi.org/10.11648/j.ijpbs.20261102.12

    Copy | Download

    ACS Style

    Lumumba, V. W.; Muriithi, D. K.; Oundo, M. A Transparent AI-Driven Ensemble Learning Approach for Predicting Mental Health Risks among University Students in Kenya. Int. J. Psychol. Brain Sci. 2026, 11(2), 35-51. doi: 10.11648/j.ijpbs.20261102.12

    Copy | Download

    AMA Style

    Lumumba VW, Muriithi DK, Oundo M. A Transparent AI-Driven Ensemble Learning Approach for Predicting Mental Health Risks among University Students in Kenya. Int J Psychol Brain Sci. 2026;11(2):35-51. doi: 10.11648/j.ijpbs.20261102.12

    Copy | Download

  • @article{10.11648/j.ijpbs.20261102.12,
      author = {Victor Wandera Lumumba and Dennis Kariuki Muriithi and Monica Oundo},
      title = {A Transparent AI-Driven Ensemble Learning Approach for Predicting Mental Health Risks among University Students in Kenya},
      journal = {International Journal of Psychological and Brain Sciences},
      volume = {11},
      number = {2},
      pages = {35-51},
      doi = {10.11648/j.ijpbs.20261102.12},
      url = {https://doi.org/10.11648/j.ijpbs.20261102.12},
      eprint = {https://article.sciencepublishinggroup.com/pdf/10.11648.j.ijpbs.20261102.12},
      abstract = {This study addresses the escalating mental health crisis among university students in Kenya, where psychological distress, driven by academic, financial, social, and transitional pressures, is increasingly prevalent yet under-prioritized in public health discourse. While global studies report distress rates exceeding 75% and Kenyan prevalence exceeds 40%, there remains a critical lack of localized, data-driven models to enable early detection in sub-Saharan African university settings. To address this gap, we developed transparent ensemble machine learning models, Random Forest (RF) and Extreme Gradient Boosting (XGBoost), to predict mental health distress levels (low, moderate, high) among 1,128 students across universities in Tharaka Nithi County, Kenya. Using a structured questionnaire incorporating demographic, academic, financial, psychosocial, and Quarter-Life Crisis (QLC) factors, we trained the models on 70% of the data and evaluated them on the remaining 30%. Both models achieved high performance: RF and XGBoost attained 98.8% accuracy (95% CI: 96.9–99.7%), Cohen’s Kappa of 0.978, and multi-class AUCs of 1.000 (RF) and ≥0.997 (XGBoost). Class-specific metrics revealed near-perfect precision, recall, and F1-scores; for high distress, both models achieved 100% sensitivity and specificity, with F1-scores of 1.000 (RF) and 0.988 (XGBoost). SHAP and feature importance analyses identified “Quarter-Life Crisis,” faculty of study (especially Science, Technology, Nursing, and Engineering), personal/mental health history, financial stress, and residence as top predictors. These findings support the use of interpretable AI for equitable, early-risk screening. However, careful attention must be paid to ethical considerations, including data privacy, potential algorithmic bias, and mental health stigma. We recommend integrating such models into university wellness platforms to enable proactive, targeted support for at-risk students.},
     year = {2026}
    }
    

    Copy | Download

  • TY  - JOUR
    T1  - A Transparent AI-Driven Ensemble Learning Approach for Predicting Mental Health Risks among University Students in Kenya
    AU  - Victor Wandera Lumumba
    AU  - Dennis Kariuki Muriithi
    AU  - Monica Oundo
    Y1  - 2026/08/20
    PY  - 2026
    N1  - https://doi.org/10.11648/j.ijpbs.20261102.12
    DO  - 10.11648/j.ijpbs.20261102.12
    T2  - International Journal of Psychological and Brain Sciences
    JF  - International Journal of Psychological and Brain Sciences
    JO  - International Journal of Psychological and Brain Sciences
    SP  - 35
    EP  - 51
    PB  - Science Publishing Group
    SN  - 2575-1573
    UR  - https://doi.org/10.11648/j.ijpbs.20261102.12
    AB  - This study addresses the escalating mental health crisis among university students in Kenya, where psychological distress, driven by academic, financial, social, and transitional pressures, is increasingly prevalent yet under-prioritized in public health discourse. While global studies report distress rates exceeding 75% and Kenyan prevalence exceeds 40%, there remains a critical lack of localized, data-driven models to enable early detection in sub-Saharan African university settings. To address this gap, we developed transparent ensemble machine learning models, Random Forest (RF) and Extreme Gradient Boosting (XGBoost), to predict mental health distress levels (low, moderate, high) among 1,128 students across universities in Tharaka Nithi County, Kenya. Using a structured questionnaire incorporating demographic, academic, financial, psychosocial, and Quarter-Life Crisis (QLC) factors, we trained the models on 70% of the data and evaluated them on the remaining 30%. Both models achieved high performance: RF and XGBoost attained 98.8% accuracy (95% CI: 96.9–99.7%), Cohen’s Kappa of 0.978, and multi-class AUCs of 1.000 (RF) and ≥0.997 (XGBoost). Class-specific metrics revealed near-perfect precision, recall, and F1-scores; for high distress, both models achieved 100% sensitivity and specificity, with F1-scores of 1.000 (RF) and 0.988 (XGBoost). SHAP and feature importance analyses identified “Quarter-Life Crisis,” faculty of study (especially Science, Technology, Nursing, and Engineering), personal/mental health history, financial stress, and residence as top predictors. These findings support the use of interpretable AI for equitable, early-risk screening. However, careful attention must be paid to ethical considerations, including data privacy, potential algorithmic bias, and mental health stigma. We recommend integrating such models into university wellness platforms to enable proactive, targeted support for at-risk students.
    VL  - 11
    IS  - 2
    ER  - 

    Copy | Download

Author Information