Abstract
This study employs a coupling coordination model to explore the coupling coordination level of population agglomeration and urban resilience in 31 provinces of China from 2006 to 2022. Furthermore, grey relational analysis and spatial Durbin model are utilized to investigate the internal and external driving factors that affect the coupling coordination. The main findings are as follows: (1) The overall level of population agglomeration in China has remained relatively stable, while urban resilience has exhibited a steady upward trend. Both indicators are markedly higher in the eastern region compared to other regions. Although the central region demonstrates a higher degree of population agglomeration than the northeast and western regions, its urban resilience is relatively low. (2) The coupling coordination degree between population agglomeration and urban resilience has steadily improved, and it has moved from serious imbalance to mild imbalance. Spatially, the coupling coordination exhibits a descending gradient from the east to the central, northeast, and western regions. (3) Internal driving factors display significant regional heterogeneity. In the eastern region, enhancing economic and infrastructure resilience is of critical importance. In the central region, priority should be given to the improvement of ecological resilience. In the northeast and western regions, efforts should focus on promoting population agglomeration and strengthening both economic and social resilience. Among the external driving factors, marketization level, human capital, and technological innovation all play a promoting role, while government intervention acts as a hindrance. Notably, human capital and technological innovation generate significant positive spatial spillover effects, while improvements in marketization and heightened government intervention tend to produce negative externalities in neighboring regions.
Keywords
Population Agglomeration, Urban Resilience, Coupling Coordination, Driving Factors
1. Introduction
Urbanization constitutes a fundamental pathway toward national modernization
| [8] | Jin X, Liu S and Du H, et al. (2023). A key issue of new urbanization research: Family function and sustainable development of agricultural transfer population. Journal of Xi’an Jiaotong University (Social Sciences), 43(4), pp. 23-35.
https://doi.org/10.15896/j.xjtuskxb.202304003 |
[8]
, playing a pivotal role in stimulating domestic demand and driving industrial upgrading and structural transformation. Since the launch of the reform and opening-up policy, China has experienced an unprecedented and rapid process of urbanization. By the end of 2023, the number of permanent urban residents had reached 930 million, with an urbanization rate of 66.16%. However, as China enters the late stage of urbanization, it faces a host of emerging and increasingly complex challenges. These include not only frequent natural disasters such as earthquakes, floods, and typhoons, but also chronic urban problems such as air pollution, epidemics, energy shortages, climate change, and ecological degradation
. In this context, urbanization in the new era must go beyond the simplistic expansion of urban populations and adopt a more people-centered and high-quality development paradigm
. Urban development should place greater emphasis on systemic coordination and the sustainable relationship between human activities and the ecological environment
| [20] | Xu Y, Li G and Cui S, et al. (2018). Review and perspective on resilience science: From ecological theory to urban practice. Acta Ecologica Sinica, 38(15), pp. 5297-5304. |
[20]
. These priorities were highlighted in the concept of “resilient cities” put forward at the Fifth Plenary Session of the 19th Central Committee of the Communist Party of China. As a new approach to urban risk management, resilience-oriented urban development advocates not only for economic efficiency, but also for a balanced integration of economic, ecological, safety, and livability considerations. A resilient city is expected to withstand external shocks, maintain core functions, adapt to evolving conditions, and recover rapidly through internal adjustment mechanisms
.
Cities serve as the primary spaces for human activity, and population is the basic element of urban economic and social development. With the improvement of urbanization, cities have more jobs and better living environment, and it has become a trend for people to enter cities from rural areas. In recent years, the intensifying “war for talent” among major cities has prompted the population to gather in large cities and urban clusters
. According to the Seventh National Census, China now has 15 new first-tier cities, among which 11 have over 10 million permanent residents and 4 exceed 9 million. For example, Wuhan has added more than 1 million permanent residents for two years, and the permanent population in 2021 reached 13 million.
As a core element of urban development, human capital contributes significantly to labor productivity, industrial upgrading, and innovation capacity. However, population agglomeration increases the pressure on cities and brings about "urban diseases" such as traffic jams, population congestion and ecological deterioration
| [18] | Wang L, Song B and Song F (2024). A study on the impact of population agglomeration on urban economic resilience. Journal of Technical Economics and Management, (5), pp. 84-89. https://doi.org/CNKI:SUN:JXJG.0.2024-05-013 |
[18]
. Therefore, population agglomeration is an important factor affecting the level of urban resilience. This research addresses several key questions: What is the relationship between population agglomeration and urban resilience in China? Do temporal and spatial heterogeneities exist in their coupling coordination? What are the internal and external factors that influence the degree of coordination between the two systems?
To answer these questions, the structure of the paper is organized as follows: Section 2 reviews the relevant literature on population agglomeration and urban resilience, identifies existing research gaps, and highlights the innovations of this study. Section 3 introduces the construction of the population agglomeration index, urban resilience index, and the coupling coordination model. Section 4 presents the empirical results on the evolution and spatial differentiation of population agglomeration, urban resilience, and their coupling coordination across China from 2006 to 2022. Section 5 employs grey relational analysis and the Spatial Durbin Model (SDM) to identify the key influencing factors behind coupling coordination. Finally, Section 6 summarizes the main findings and offers policy recommendations for fostering the coordinated development of population agglomeration and urban resilience.
2. Literature Review
The coupling coordination between population agglomeration and urban resilience involves a bidirectional relationship: the influence of population agglomeration on urban resilience, and conversely, the impact of urban resilience on population agglomeration. As a core feature of urban development, the impact of population agglomeration on urban resilience has aroused extensive discussion. However, the academic community has not yet reached a consensus on it. Some researchers argue that population agglomeration enhances urban resilience
. They contend that the concentration of population elevates the level of human capital, thereby stimulating technological innovation and industrial upgrading
, while also facilitating the expansion of infrastructure and social security systems. However, other scholars hold the opposite view. They believe that high population densities may impose excessive burdens on urban systems, leading to environmental degradation, traffic congestion, unemployment, resource scarcity, and other challenges that ultimately undermine urban resilience
| [12] | Liu X and Wang P (2022). Population concentration, air pollution and sustainable economic development: Based on spatial econometric analysis of 266 cities above prefecture level in China. Scientific Decision Making, (11), pp. 81-93.
https://doi.org/CNKI:SUN:KXJC.0.2022-11-005 |
[12]
.
On the other hand, the level of urban resilience also has an important impact on population agglomeration, which includes four aspects: economy, society, infrastructure and ecology. Since building a resilient city is "people-centered" and the core purpose is to meet the people's demand for a better life
| [22] | Zhang C (2021). The institutional foundation, evolution mechanism and realistic path of resilient city construction in the background of digital transformation. Guizhou Social Sciences, (7), pp. 123-130. https://doi.org/10.13713/j.cnki.cssci.2021.07.017 |
[22]
, economic resilience has become the primary driving force of population agglomeration. Most scholars believe that there is a significant positive correlation between the economic level and the degree of population agglomeration
| [16] | Wang G, Pan Z and Lu Y (2012). China’s inter-provincial migration patterns and influential factors: Evidence from year 2000 and 2010 population census of China. Chinese Journal of Population Science, (5), pp. 2-13+111.
https://doi.org/CNKI:SUN:ZKRK.0.2012-05-002 |
[16]
. The main reason is that the industrial structure of regions with high level of economic development is more reasonable, and the tertiary industry has greatly expanded the absorptive capacity of the labor market, which directly leads to a significant increase in labor demand
| [9] | Li A (2017). Analysis on the spatial agglomeration and its influence factors of the floating population in Beijing-Tianjin-Hebei. Population and Economics, (6), pp. 71-78.
https://doi.org/CNKI:SUN:RKJJ.0.2017-06-007 |
[9]
. Social resilience mainly includes educational resources and medical conditions. Good urban public education has a strong attraction to the population, especially high-skilled talents, and the increase in the number of migrant children will strengthen this attraction
| [15] | Wang C and Ye B (2021). How do cities attract highly skilled talents: Based on the perspective of education system reform. Economic Research Journal, 56(6), pp. 191-208.
https://doi.org/CNKI:SUN:JJYJ.0.2021-06-012 |
[15]
. The level of urban healthcare also has an important impact on population distribution, as individuals tend to migrate to areas with better medical infrastructure and service quality
| [4] | Fang D and Yang Y (2013). The effect of urban public goods supply on migration of urban-rural population: Based on the empirical analysis of dynamic panel. Finance and Economics, (8), pp. 75-84.
https://doi.org/CNKI:SUN:CJKX.0.2013-08-010 |
[4]
. In terms of infrastructure, advancements in communication and energy systems contribute to improved living standards and can significantly promote population inflows
. The improvement of transportation infrastructure reduces the cost of population flow and promotes population agglomeration
| [2] | Cao L, Wang J and Wang H, et al. (2019). Evolutional analysis of coupling between infrastructure and population agglomeration in Beijing-Tianjin-Hebei region: An analysis based on push-pull theory. Geographical Science, 39(8), pp. 1256-1264. https://doi.org/10.13249/j.cnki.sgs.2019.08.007 |
[2]
. In terms of ecological resilience, regions with favorable climatic conditions and abundant natural resources tend to be more conducive to human settlement and economic activity, resulting in higher population densities
| [19] | Xu M, Wang M and Zhang Z, et al. (2024). Analysis of factors influencing population mobility in small and medium sized cities in northeast China: A case study in Yichun of Heilongjiang province. Economic Research Guide, (14), pp. 56-59.
https://doi.org/CNKI:SUN:JJYD.0.2024-14-014 |
[19]
. Conversely, areas with frequent natural disasters and serious pollution are relatively sparsely populated
| [23] | Zhang L, Zhou S and Zhen Z (2024). Impacts of environmental exposures on the mental health of floating and registered populations from the perspective of daily activities. Progress in Geography, 43(8), pp. 1570-1584.
https://doi.org/CNKI:SUN:DLKJ.0.2024-08-008 |
[23]
.
To sum up, the current academic research on population agglomeration and urban resilience has been relatively mature. However, most of the literature focus on the one-way impact of population agglomeration on urban resilience or urban resilience on population agglomeration, and there is little comprehensive analysis on the spatial coordination relationship between them. Compared with existing studies, the marginal contributions of this paper are as follows: first, this paper breaks through the limitations of one-way research, and constructs a two-way analysis framework of population agglomeration and urban resilience. Therefore, the spatial coordination relationship between population agglomeration and urban resilience is revealed more comprehensively. Second, this paper combines the grey correlation method and spatial Durbin model to identify the driving factors that affect the relationship between population agglomeration and urban resilience. The grey correlation method can analyze the correlation degree between various factors, while the spatial Durbin model focuses on the spatial effect.
3. Coupling Coordination Research Methods and Data Sources
3.1. Measurement of Population Agglomeration
Population agglomeration refers to the spatial concentration of population within a specific geographical region. Wang
| [18] | Wang L, Song B and Song F (2024). A study on the impact of population agglomeration on urban economic resilience. Journal of Technical Economics and Management, (5), pp. 84-89. https://doi.org/CNKI:SUN:JXJG.0.2024-05-013 |
[18]
constructed the spatial agglomeration degree of population based on the population density and population agglomeration index, which can not only reflect the distribution of population, but also avoid the overestimation of agglomeration degree caused by regional area differences. Using the method of Wang (2004) for reference, this paper calculates the population agglomeration degree according to the following formula:
(1)
where Ai denotes the population agglomeration degree of province , captures the relative intensity of population concentration by accounting for both population and land area proportions. Pi denotes the population of province (in ten thousand people), Pn denotes the total population of China (in ten thousand people), Mi represents the area of province (in ten thousand square kilometers), and Mn represents the total area of China (in ten thousand square kilometers).
3.2. Measurement of Urban Resilience
Urban resilience is a comprehensive system composed of urban economy, society, ecology and infrastructure. This paper uses the practice of
| [13] | Mao L, Xia J and Liu R (2024). A study on the coupling of digital technology and urban resilience: An empirical analysis based on data of 285 cities in China. Journal of Hohai University (Philosophy and Social Sciences), 26(2), pp. 95-106.
https://doi.org/CNKI:SUN:HHZX.0.2024-02-009 |
[13]
for reference, and selects 18 indicators from economic resilience, social resilience, ecological resilience and infrastructure resilience to build a comprehensive index system of urban resilience (
Table 1). The specific indicators are as follows: (1) Economic resilience is the ability of a city to maintain economic stability and sustainable growth in the face of internal and external risks. Among them, the economic development level reflects the economic strength and development potential of a city, which is an important cornerstone for maintaining economic stability. The gross domestic product (GDP) per capita is selected to represent. A reasonable industrial structure should have diversity and complementarity, be able to cope with various changes in the market, and use the proportion of tertiary industry to GDP to reflect. Investment capacity represents the economic efficiency and development potential of a city, and fixed asset investment per capita is selected as an indicator. Opening up means more resources and opportunities, measured by the total investment of foreign-invested enterprises. The level of residents' income is directly related to the living standard and consumption ability of residents, measured by the total average wage of employees. (2) Social resilience is the basic social security capacity and development potential when a city is disturbed, so four indicators are selected from education, medical care and old-age care. That is, the number of college students per one hundred thousand population, the ratio of students to teachers in colleges and universities, the number of beds in medical institutions per 10,000 people and the participation rate of urban basic endowment insurance. (3) Ecological resilience is the ability of urban ecosystem to cope with climate change and environmental degradation. From the three dimensions of ecological state, ecological pressure and ecological response, the per capita park green area, sulphur dioxide emissions per unit of GDP, the comprehensive utilization rate of industrial solid waste, the proportion of investment in environmental pollution control in GDP, and the harmless treatment rate of domestic waste are selected as the measurement indicators. Among them, the sulfur dioxide emission per unit GDP reflects the pressure of urban economic activities on the ecosystem, which is a negative indicator. (4) Infrastructure resilience emphasizes the city's response, guarantee and recovery ability in the face of disasters. From the four aspects of water, gas, transportation and communication, indicators such as water penetration rate, gas penetration rate, buses per 10,000 people, and mobile phone penetration rate are selected.
In order to avoid the subjective error caused by artificial empowerment, this paper adopts the entropy weight method to calculate the urban resilience level. Referring to the processing method of Yang
| [21] | Yang M and Hu D (2024). Research on high quality tourism development in six provinces of central China based on entropy weight and TOPSIS method. Journal of Nanyang Normal University, 23(1), pp. 9-16.
https://doi.org/CNKI:SUN:NYSF.0.2024-01-002 |
[21]
, the calculation proceeds as follows:
The first step is to standardize the data by using the range method.
Positive indicators:
(2)
Negative indicators:
(3)
In the formula, is the standardized value, and represents the original value of index in area .
The second step is to calculate the entropy value:
In the above formula, represents the research object,, represents the evaluation index, .
The third step is to calculate the entropy weight:
The fourth step is to calculate the urban resilience level based on the entropy weight:
Table 1. Evaluation Index System for Urban Resilience.
Criteria Layer | Indicator Layer | Unit | Weight | Indicator Attribute |
Economic resilience | GDP per capita | Yuan | 0.065 8 | + |
The proportion of the third industry to GDP | % | 0.054 2 | + |
Fixed assets investment per capita | CNY | 0.071 7 | + |
Total investment of foreign-invested enterprises | hundreds of millions of dollars | 0.133 0 | + |
Total average wage of employees | CNY | 0.051 8 | + |
Social resilience | Number of college students per one hundred thousand population | person | 0.020 3 | + |
The ratio of students to teachers in Colleges and Universities | person | 0.098 2 | + |
Number of beds in medical institutions per 10,000 people | unit | 0.069 9 | + |
Participation rate of urban basic endowment insurance | % | 0.100 3 | + |
Ecological resilience | Per capita park green area | m2 | 0.046 0 | + |
sulphur dioxide emissions per unit of GDP | ton/100 million yuan | 0.004 3 | − |
Comprehensive utilization rate of industrial solid waste | % | 0.004 4 | + |
The proportion of investment in environmental pollution control in GDP | % | 0.064 5 | + |
Harmless treatment rate of domestic waste | % | 0.065 8 | + |
Infrastructure resilience | Water penetration rate | % | 0.003 4 | + |
Gas penetration rate | % | 0.008 2 | + |
Buses per 10,000 people | unit | 0.043 2 | + |
Mobile phone penetration rate | % | 0.094 3 | + |
3.3. The Coupling Coordination Model of Population Agglomeration and Urban Resilience
Coupled coordination emphasizes that population agglomeration is in step with the development of urban resilience systems. If one system significantly lags behind or outpaces the other, the overall performance and efficiency of the composite system will be impaired. Based on the concept of coupling in physics, a coupling coordination model is constructed
| [7] | Jiang L, Bai L and Wu Y (2017). Coupling and coordinating degrees of provincial economy, resources and environment in China. Journal of Natural Resources, 32(5), pp. 788-799.
https://doi.org/CNKI:SUN:ZRZX.0.2017-05-007 |
[7]
. The specific formula is as follows:
(9)
In the above formula,
is the coupling degree,
is the coordination degree,
represents the degree of population agglomeration.
represents the level of urban resilience, because the two are equally important,
and
weights are 1/2. The final output,
, is the coupling coordination degree, which takes values in the range
. A higher value of
indicates a more balanced and synergistic relationship between the two subsystems. Referring to the method proposed by Guo
| [6] | Guo X, Li X and Tian J (2024). Study on coupling coordination between the urban resilience and the population distribution in cities on the Guizhou plateau. Journal of Natural Science of Hunan Normal University, 47(4), pp. 72-80. |
[6]
, the coupling coordination degree is divided into 6 levels in this paper (
Table 2).
Table 2. Types of Coupling Coordination.
| Coupling coordination state | | Coupling coordination state |
| Extreme imbalance | | Primary Coordination |
| Serious imbalance | | Intermediate coordination |
| Mild imbalance | | Advanced Coordination |
3.4. Data Sources
The research object of this article is 31 provinces in inland China, covering the period from 2006 to 2022. All data is sourced from the China Statistical Yearbook, regional statistical yearbooks, and EPS database. To address occasional instances of missing data, linear interpolation is employed to ensure continuity and completeness of the dataset.
4. Analysis of Coupling Coordination Results
4.1. Temporal and Spatial Evolution of Population Agglomeration
Using formula (
1), the population agglomeration levels for Eastern, Northeastern, Central, and Western regions were calculated for the period 2006–2022, along with the national average. The results are presented in
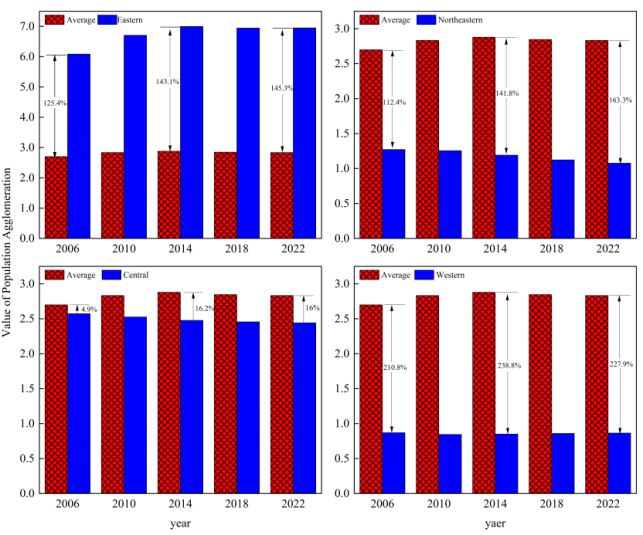
Figure 1. As illustrated in the figure, under the influence of the household registration system, the national average population agglomeration level has remained relatively stable, fluctuating within the range of [2.7, 2.9]. From a regional perspective, there are significant differences in population agglomeration levels among the four major regions, with agglomeration levels ranging from high to low in the eastern, central, northeastern, and western regions. The Eastern region exhibits the highest degree of population agglomeration, primarily driven by its advantageous geographical location, advanced level of economic development, and superior public services such as education and healthcare. In 2022, the population agglomeration level in the eastern region reached 6.95, which is 145.3% higher than the national average level. In contrast, the Northeastern, Central, and Western regions all fall below the national average. Specifically, the population agglomeration level in Northeast China decreased from 1.27 to 1.08 from 2006 to 2022. This is mainly due to the adjustment of the economic structure in Northeast China, where traditional industries are affected by resource depletion and lack development momentum. The Central region, which serves as a transitional hub connecting the east and west as well as the north and south, maintains a relatively high population agglomeration. However, it has also suffered from population outflows, with the agglomeration level decreasing from 2.57 to 2.44 over the study period. Western region, constrained by its challenging geography and underdeveloped economic base, faces lower quality of life and limited access to public services. These factors have contributed to sustained out-migration. The population agglomeration level in the western region in 2022 is only 0.86.
Figure 1. Population Agglomeration in China and Four Major Regions from 2006 to 2022.
4.2. Temporal and Spatial Evolution of Urban Resilience
Using formulas (
2) to (
8), the levels of urban resilience were calculated for the Eastern, Northeastern, Central, and Western regions, as well as the national average. The results are presented in
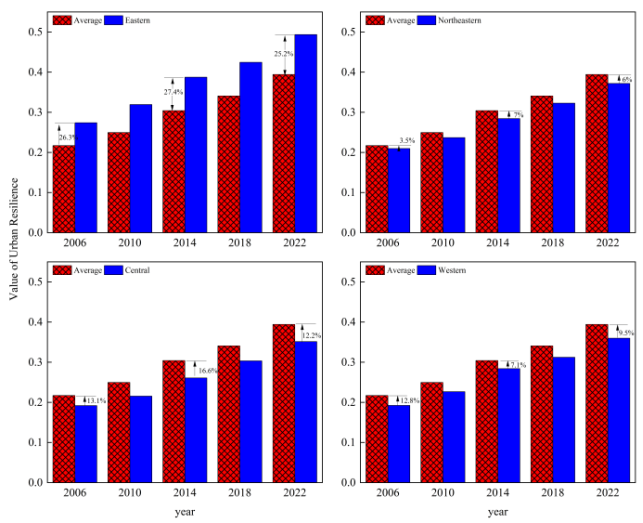
Figure 2. From 2006 to 2022, China’s average urban resilience level increased steadily from 0.22 to 0.39, reflecting an average annual growth rate of 5.1%. However, urban resilience shows a decreasing distribution in the east, northeast, west, and central regions. Among them, the urban resilience in the eastern region reached 0.49 in 2022, which is 25.2% higher than the average level. This strong performance can be attributed to a solid economic base, a well-educated labor force, and a highly optimized industrial structure. However, due to geographical, historical, and economic constraints, the resilience of the Northeast, West, and Central regions is lower than the national average. It is worth noting that the resilience of cities in the Northeast and Western regions is higher than that in the Central region. This is because in recent years, the Northeast and Western regions have received strong support from the government, such as revitalizing the old industrial base in Northeast China and large-scale development of the western region. The Central region, despite its strategic geographic position, lags behind in resilience performance. The region suffers from a relatively undiversified industrial structure and an extensive growth model that relies heavily on resource input rather than innovation and efficiency. These structural limitations have constrained its capacity to respond to shocks and sustain long-term resilience.
Figure 2. Urban Resilience in China and Four Major Regions from 2006 to 2022.
4.3. Temporal and Spatial Evolution of the Coupling Coordination Between Population Agglomeration and Urban Resilience
Using formulas (
9) to (
11), the coupling coordination degree between population agglomeration and urban resilience was calculated for the Eastern, Northeastern, Central, and Western regions, as well as the national average. The results are illustrated in
Figure 3. Combining the coupling coordination types (
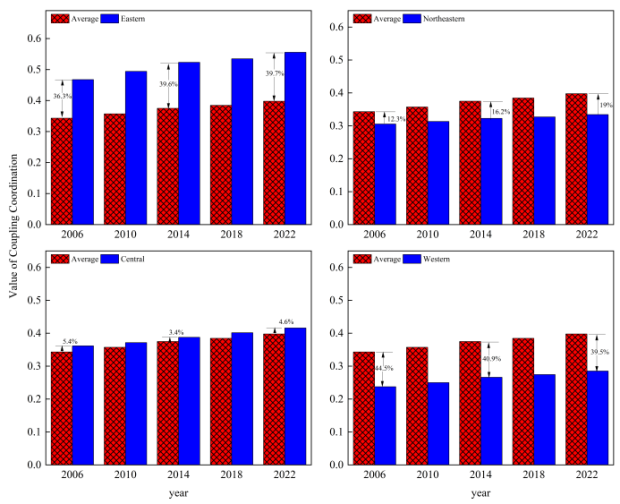
Table 2), it can be found that the overall coupling coordination degree between population agglomeration and urban resilience shows a continuous growth trend. In 2006, the national average coupling coordination degree was 0.34, which was in serious imbalance. By 2010, the index had risen modestly to 0.36, marking a transition to the mild imbalance stage. By 2022, the national average had reached 0.40.
From a regional perspective, the Eastern region demonstrated the most significant progress, with the coupling coordination degree increasing from 0.47 in 2006 to 0.56 in 2022. In contrast, the Northeastern region exhibited the slowest growth, with the coordination degree rising only marginally from 0.31 to 0.33, remaining consistently below the national average throughout the period. The Central region experienced moderate improvement, with the coordination degree increasing from 0.36 to 0.42—maintaining a classification of mild imbalance. Meanwhile, the Western region, constrained by both geographical and economic disadvantages, recorded the lowest values across the board. Its coordination degree increased only slightly, from 0.24 in 2006 to 0.29 in 2022, indicating a persistent state of serious imbalance.
Spatially, the coordination degree follows a clear gradient: East > Central > Northeast > West. A particularly noteworthy finding is that although the urban resilience level of the northeast and western regions is higher than that of the central region, the coupling coordination degree of population agglomeration and urban resilience is not as good as that of the central region.
Figure 3. Coupling Coordination of Population Agglomeration and Urban Resilience in China and Four Major Regions from 2006 to 2022.
5. The Driving Factors of the Coupling Coordination Degree
The coupling and coordination between population agglomeration and urban resilience is a dynamic and multifaceted process, shaped not only by internal factors intrinsic to urban systems, but also by external drivers such as marketization, human capital, technological innovation, and government intervention. To comprehensively identify and assess these influencing mechanisms, this study adopts a dual-method approach: the grey relational analysis is employed to examine internal factors, while the spatial Durbin model is used to explore external drivers and their spatial spillover effects.
5.1. Internal Driving Factors - Grey Correlation Analysis
The grey correlation analysis method is often used to analyze the influence degree of various factors. The core idea is to compare the similarity of reference series and comparison series curve shapes. A higher grey relational degree indicates a stronger influence of the comparison variable on the reference system. The calculation process is as follows:
The coupling coordination degree of population agglomeration and urban resilience is taken as the reference sequence , and the urban economic resilience, social resilience, ecological resilience, infrastructure resilience and population agglomeration are taken as the comparison sequence . All series are first subjected to dimensionless normalization to ensure comparability across different scales and units. Then, the grey relational coefficient is calculated using the following formula:
(12)
The resolution coefficient was set to 0.5, and then the correlation degree was calculated:
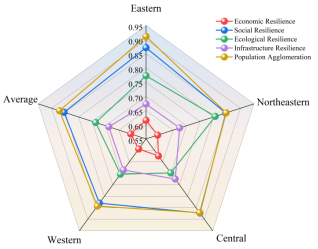
Figure 4 presents the results of the grey relational analysis. At the national level, the average grey relational degree for population agglomeration is 0.871, which is significantly higher than those for the other four dimensions. This finding indicates that population agglomeration has the most substantial impact on the coupling coordination system. This result can be attributed to the foundational role of population agglomeration in urban development—it brings abundant labor resources, supports industrial expansion, fosters complex and dense social networks, facilitates knowledge and technological exchange, and thus strengthens the interdependence between population agglomeration and urban resilience. In contrast, the core dimensions of urban resilience primarily serve supportive and safeguard functions, and their feedback effects on population agglomeration tend to be delayed. For example, improvements in infrastructure require long-term investment, and the impacts of household registration and housing policies typically materialize over extended periods.
Figure 4. Grey Correlation Degree of Internal Driving Factors for The Coupling Coordination of Population Agglomeration and Urban Resilience.
Data sources: China Statistical Yearbook, regional statistical yearbooks, and EPS database.
This also helps explain why the urban resilience levels in the Northeastern and Western regions exceed those of the Central region, while their coupling coordination degrees remain lower. The relatively weak population agglomeration in these two regions hinders the efficient maintenance and upgrading of infrastructure and public service systems. Simultaneously, the challenges of industrial restructuring further constrain population inflows, resulting in a disconnection between resilience construction efforts and actual population demand.
In the Eastern region, the grey relational degrees for economic resilience and infrastructure resilience are 0.615 and 0.673, respectively—substantially lower than those for population agglomeration (0.911), social resilience (0.871), and ecological resilience (0.772). This suggests that while the region excels in attracting high-skilled labor through mature traditional industries and the growth of emerging sectors, it offers limited absorption capacity for ordinary labor. Moreover, the already well-developed infrastructure leads to diminishing marginal returns in terms of resilience enhancement.
In the Central region, the grey relational degrees for population agglomeration (0.871), economic resilience (0.624), social resilience (0.873), and infrastructure resilience (0.725) are all higher than the national average, reflecting the region’s relatively balanced development. However, the correlation degree for ecological resilience is only 0.698, lower than the national average. Comparatively, the Eastern region has significantly improved its ecological environment through industrial upgrading and increased environmental investment, reaching a correlation degree of 0.772. The Western region, supported by favorable ecological endowments and national policies, has also achieved notable progress in ecological protection, with a degree of 0.704. The Northeast, being a key focus of national ecological restoration programs, exhibits an even higher degree of 0.807. In contrast, the Central region continues to struggle with pollution stemming from extensive economic development and insufficient investment in ecological restoration.
The grey relational degree of population agglomeration in the Northeast and Western regions is 0.847 and 0.843, respectively—both lower than the national average of 0.871. Likewise, their economic resilience degrees (0.593 for the Northeast and 0.594 for the West) are below the national benchmark. In terms of social resilience, the Northeast and West record values of 0.846 and 0.830, respectively, compared to the national average of 0.854. The underlying reasons are structural: the Northeast has long been dominated by heavy industry, resulting in youth outmigration and a rapidly aging population. Meanwhile, the Western region’s economic structure remains fragile due to its reliance on the energy sector, and its ethnically diverse composition poses additional challenges for social integration and governance.
5.2. External Driving Factors - Spatial Durbin Model
To investigate the impact of external factors on the coupling coordination degree between population agglomeration and urban resilience, this study employs a spatial econometric approach. Following the model selection strategy proposed by
, various specifications of spatial panel models were tested. The results indicate that the Spatial Durbin Model (SDM) with time-fixed effects is the most appropriate specification for the data and research objectives. The model is specified as follows:
(14)
In the formula,
is the coupling coordination degree, and
is the constant term,
is the spatial regression coefficient, and
is the independent variable,
is the spatial error coefficient,
is the spatial lag coefficient,
is the error term. Based on the existing studies
| [14] | Ren X and Yin Z (2019). Spatial-temporal coupling and driving factors of provincial population aggregation, public resource allocation and service industry development in China. China Population, Resources and Environment, 29(12), pp. 77-86.
https://doi.org/CNKI:SUN:ZGRZ.0.2019-12-009 |
[14]
, the following 4 variables are selected as the explanatory variables of the model: (1) the degree of marketization
, mainly measured by the marketization index. (2) Human capital
is calculated by the proportion of the number of people above junior college to the total population. (3) Technological innovation
is measured by the number of patent applications. (4) The government intervention
is represented by the regional fiscal expenditure. In order to reduce heteroscedasticity and colinearity, all variables were logarithm treated.
To conserve space, this paper reports only the effect decomposition results, which facilitate the identification of direct effects, indirect effects (i.e., spatial spillover effects), and total effects. The detailed results are presented in
Table 3.
Table 3. Regression results of spatial Durbin model.
Variable | Direct effect | Indirect effect | Total effect |
lnM | 0.032*** (0.001) | -0.11*** (0.000) | -0.078*** (0.000) |
lnH | 0.625*** (0.000) | 0.365*** (0.000) | 0.991*** (0.000) |
lnZ | 0.029*** (0.000) | 0.048*** (0.000) | 0.078*** (0.000) |
lnC | -0.012** (0.041) | -0.052*** 0.000) | -0.065*** (0.000) |
Data Description: p<0.01, **p<0.05, *p<0.1, The p value is inside the bracket. The data are from China Statistical Yearbook, regional statistical yearbooks and EPS database.
The direct effect of marketization level is estimated at 0.032 and is statistically significant and positive. This suggests that in regions with a higher degree of marketization, population and resources respond more effectively to supply–demand changes, autonomously flowing toward high-return sectors. As a result, both population agglomeration and urban resilience tend to develop in a more synchronized and coordinated manner. However, the indirect effect is –0.110, indicating that the improvement of marketization in one region negatively impacts the coupling coordination in adjacent regions. This may be due to the competitive advantage enjoyed by highly marketized areas—characterized by efficient resource allocation, strong economic performance, and favorable business environments—which attract population, enterprises, and other resources from surrounding regions, thereby undermining their coordinated development.
The direct effect of human capital is 0.625, significantly positive, implying that an increase in human capital enhances the coupling coordination degree. This occurs through improved income and consumption levels, strengthened economic capacity, and heightened environmental awareness—all of which contribute to greater urban resilience. Additionally, high-level human capital plays a critical role in generating innovative solutions for urban development. The indirect effect, estimated at 0.365, is also significantly positive, revealing that the accumulation of human capital in one region promotes coordinated development in neighboring areas through channels such as knowledge spillovers, labor mobility, and economic interlinkages.
For technological innovation, both the direct effect (0.029) and indirect effect (0.048) are significantly positive. On the one hand, technological advancement enhances enterprise productivity, drives industrial upgrading, and improves urban operational efficiency, thus reinforcing urban resilience and attractiveness to skilled populations. On the other hand, technology diffusion fosters knowledge spillovers across regions, amplifying positive externalities.
In contrast, government intervention exhibits negative direct (–0.012) and indirect effects (–0.052). This may be attributed to institutional rigidities such as the household registration system and provincial segmentation of public services, which restrict population mobility and resource flows. Moreover, excessive administrative intervention may suppress innovation, limit enterprise flexibility, and hinder efficient resource allocation. In some cases, local governments may deliberately restrict cross-regional flows of talent and technology to maintain a competitive edge, leading to market fragmentation and reduced spatial coordination.
6. Conclusion and Discussion
This study measures the urban resilience level of 31 provinces in China from 2006 to 2022 using the entropy weight method, constructs a coupling coordination model between population agglomeration and urban resilience, and identifies the internal and external driving factors through grey relational analysis and the spatial Durbin model. The main conclusions are as follows:
First, population agglomeration has remained relatively stable during the study period, with national values ranging between 2.7 and 2.85. There was no large-scale and rapid population change, and the spatial pattern generally follows a descending gradient: East > Central > Northeast > West. Meanwhile, urban resilience levels have shown steady improvement, especially in the eastern region, which consistently outperforms the national average. Notably, the northeastern and western regions have also surpassed the central region in urban resilience.
Second, the coupling coordination degree between population agglomeration and urban resilience has increased nationally and across all four regions. The spatial pattern of coordination also follows an East > Central > Northeast > West trajectory.
Third, the relative strength of internal driving factors follows the order: population agglomeration > social resilience > ecological resilience > infrastructure resilience > economic resilience. In the eastern region, strengthening economic and infrastructure resilience is most urgent. The central region should focus on improving ecological resilience, while the northeast and western regions need to prioritize population agglomeration, economic revitalization, and social system resilience. Regarding external factors, marketization, human capital, and technological innovation positively influence coordination, whereas government intervention exhibits a dampening effect. Moreover, human capital and technological innovation generate positive spatial spillovers, while marketization and government intervention may inhibit neighboring regions’ coordinated development.
Based on these findings, the following policy recommendations are proposed: Firstly, optimize the institutional environment and enable market forces. China should continue breaking down systemic and institutional barriers to improve factor mobility and allow the market to play a decisive role in resource allocation. Government intervention should shift from direct control to regulatory and facilitative roles. In terms of human capital, investments should be made in high-quality education, vocational training, and lifelong learning systems. Additionally, an open and inclusive talent flow mechanism should be established to foster cross-regional knowledge exchange and spillovers. For technological innovation, it is essential to increase funding for research and development and strengthen intellectual property protection. Establishing national innovation centers and industrial incubators will further support the integration of emerging technologies into urban development and resilience strategies.
Secondly, the Eastern region should focus on boosting emerging industries, increasing the value-added of technology-driven products, and expanding employment. Policymakers should encourage industrial clustering in urban agglomerations such as the Yangtze River Delta and Pearl River Delta to foster global competitiveness. In infrastructure, investment should target smart systems—including 5G, internet of things, and intelligent transport networks—to elevate service resilience and create new growth drivers. Furthermore, attention should be paid to intra-regional disparities by enhancing basic infrastructure in underdeveloped rural or remote areas to ensure balanced growth.
Thirdly, the central region maintains its advantages in population, economy, society and infrastructure. At the same time, it must accelerate ecological restoration. Investment should be directed toward soil erosion control, wetland conservation, and afforestation projects. When receiving industrial transfers from the East, it is vital to prioritize environmentally compatible industries. Regulatory enforcement should be strengthened to raise the cost of environmental violations, while public awareness campaigns should promote environmental stewardship among citizens and enterprises alike.
Fourthly, in order to improve the level of population agglomeration in the northeast and western regions, strengthening economic and social resilience is the key. To reverse population outflows, targeted talent attraction policies—such as housing subsidies, entrepreneurship incentives, and educational benefits—should be adopted. In the Northeast, the industrial base can be revitalized through technological upgrading and enterprise restructuring. The West should leverage its natural resource endowment to develop specialized agriculture, energy sectors, and eco-tourism. Moreover, both regions should invest in community infrastructure, enrich public services, and encourage the development of civil society organizations to promote participatory governance and social cohesion.
Abbreviations
SDM | Spatial Durbin Model |
GDP | Gross Domestic Product |
Funding
This work was supported by National Social Sciences Fund in China (Grant numbers: 22BRK001).
Author Contributions
Duan Pingzhong: Conceptualization, Data curation, Funding acquisition, Methodology, Supervision
Yin Jialing: Data curation, Formal Analysis, Investigation, Writing – original draft, Writing – review & editing
Conflicts of Interest
The authors declare no conflicts of interest.
References
| [1] |
Ahern J (2011). From fail-safe to safe-to-fail: Sustainability and resilience in the new urban world. Landscape and Urban Planning. 100(4), pp. 341-343.
https://doi.org/10.1016/j.landurbplan.2011.02.021
|
| [2] |
Cao L, Wang J and Wang H, et al. (2019). Evolutional analysis of coupling between infrastructure and population agglomeration in Beijing-Tianjin-Hebei region: An analysis based on push-pull theory. Geographical Science, 39(8), pp. 1256-1264.
https://doi.org/10.13249/j.cnki.sgs.2019.08.007
|
| [3] |
Elhorst JP (2014). Matlab software for spatial panels. International Regional Science Review, 37(3), pp. 389-405.
https://doi.org/10.1177/0160017612452429
|
| [4] |
Fang D and Yang Y (2013). The effect of urban public goods supply on migration of urban-rural population: Based on the empirical analysis of dynamic panel. Finance and Economics, (8), pp. 75-84.
https://doi.org/CNKI:SUN:CJKX.0.2013-08-010
|
| [5] |
Fu Y and Yue Y (2024). The impact of smart city pilot policy on urban resilience: Effects and mechanisms. The Journal of Humanities, (3), pp. 130-140.
https://doi.org/10.15895/j.cnki.rwzz.2024.03.014
|
| [6] |
Guo X, Li X and Tian J (2024). Study on coupling coordination between the urban resilience and the population distribution in cities on the Guizhou plateau. Journal of Natural Science of Hunan Normal University, 47(4), pp. 72-80.
|
| [7] |
Jiang L, Bai L and Wu Y (2017). Coupling and coordinating degrees of provincial economy, resources and environment in China. Journal of Natural Resources, 32(5), pp. 788-799.
https://doi.org/CNKI:SUN:ZRZX.0.2017-05-007
|
| [8] |
Jin X, Liu S and Du H, et al. (2023). A key issue of new urbanization research: Family function and sustainable development of agricultural transfer population. Journal of Xi’an Jiaotong University (Social Sciences), 43(4), pp. 23-35.
https://doi.org/10.15896/j.xjtuskxb.202304003
|
| [9] |
Li A (2017). Analysis on the spatial agglomeration and its influence factors of the floating population in Beijing-Tianjin-Hebei. Population and Economics, (6), pp. 71-78.
https://doi.org/CNKI:SUN:RKJJ.0.2017-06-007
|
| [10] |
Li M and Zhang L (2020). The impact of urban infrastructure investment on urban population growth: Empirical evidence based on Shanghai. Statistics and Decision, 36(7), pp. 108-112.
https://doi.org/10.13546/j.cnki.tjyjc.2020.07.023
|
| [11] |
Liang Y, You S and Liu B (2023). Population agglomeration, human resources matching and industrial upgrading. Northwest Population Journal, 44(5), pp. 84-97.
https://doi.org/10.15884/j.cnki.issn.1007-0672.2023.05.007
|
| [12] |
Liu X and Wang P (2022). Population concentration, air pollution and sustainable economic development: Based on spatial econometric analysis of 266 cities above prefecture level in China. Scientific Decision Making, (11), pp. 81-93.
https://doi.org/CNKI:SUN:KXJC.0.2022-11-005
|
| [13] |
Mao L, Xia J and Liu R (2024). A study on the coupling of digital technology and urban resilience: An empirical analysis based on data of 285 cities in China. Journal of Hohai University (Philosophy and Social Sciences), 26(2), pp. 95-106.
https://doi.org/CNKI:SUN:HHZX.0.2024-02-009
|
| [14] |
Ren X and Yin Z (2019). Spatial-temporal coupling and driving factors of provincial population aggregation, public resource allocation and service industry development in China. China Population, Resources and Environment, 29(12), pp. 77-86.
https://doi.org/CNKI:SUN:ZGRZ.0.2019-12-009
|
| [15] |
Wang C and Ye B (2021). How do cities attract highly skilled talents: Based on the perspective of education system reform. Economic Research Journal, 56(6), pp. 191-208.
https://doi.org/CNKI:SUN:JJYJ.0.2021-06-012
|
| [16] |
Wang G, Pan Z and Lu Y (2012). China’s inter-provincial migration patterns and influential factors: Evidence from year 2000 and 2010 population census of China. Chinese Journal of Population Science, (5), pp. 2-13+111.
https://doi.org/CNKI:SUN:ZKRK.0.2012-05-002
|
| [17] |
Wang J and Fu X (2023). Digital economy, industrial structure and urban economic resilience. Regional Economic Review, 62(2), pp. 70-78.
https://doi.org/10.14017/j.cnki.2095-5766.2023.0034
|
| [18] |
Wang L, Song B and Song F (2024). A study on the impact of population agglomeration on urban economic resilience. Journal of Technical Economics and Management, (5), pp. 84-89.
https://doi.org/CNKI:SUN:JXJG.0.2024-05-013
|
| [19] |
Xu M, Wang M and Zhang Z, et al. (2024). Analysis of factors influencing population mobility in small and medium sized cities in northeast China: A case study in Yichun of Heilongjiang province. Economic Research Guide, (14), pp. 56-59.
https://doi.org/CNKI:SUN:JJYD.0.2024-14-014
|
| [20] |
Xu Y, Li G and Cui S, et al. (2018). Review and perspective on resilience science: From ecological theory to urban practice. Acta Ecologica Sinica, 38(15), pp. 5297-5304.
|
| [21] |
Yang M and Hu D (2024). Research on high quality tourism development in six provinces of central China based on entropy weight and TOPSIS method. Journal of Nanyang Normal University, 23(1), pp. 9-16.
https://doi.org/CNKI:SUN:NYSF.0.2024-01-002
|
| [22] |
Zhang C (2021). The institutional foundation, evolution mechanism and realistic path of resilient city construction in the background of digital transformation. Guizhou Social Sciences, (7), pp. 123-130.
https://doi.org/10.13713/j.cnki.cssci.2021.07.017
|
| [23] |
Zhang L, Zhou S and Zhen Z (2024). Impacts of environmental exposures on the mental health of floating and registered populations from the perspective of daily activities. Progress in Geography, 43(8), pp. 1570-1584.
https://doi.org/CNKI:SUN:DLKJ.0.2024-08-008
|
| [24] |
Zhang S, Ma X and Xiong J, et al. (2023). The impact of population agglomeration on urban resilience. Northwest Population Journal, 44(1), pp. 76-90.
https://doi.org/10.15884/j.cnki.issn.1007-0672.2023.01.006
|
| [25] |
Zheng X, Yin Z and He Y, et al. (2023). People-centred new urbanization. City Planning Review, 47(12), pp. 55-60.
https://doi.org/CNKI:SUN:CSGH.0.2023-12-007
|
Cite This Article
-
APA Style
Pingzhong, D., Jialing, Y. (2026). The Spatio-temporal Coupling Coordination and Driving Factors of Population Agglomeration and Urban Resilience. Journal of Public Policy and Administration, 10(1), 80-92. https://doi.org/10.11648/j.jppa.20261001.18
 Copy
|
Copy
|
 Download
ACS Style
Pingzhong, D.; Jialing, Y. The Spatio-temporal Coupling Coordination and Driving Factors of Population Agglomeration and Urban Resilience. J. Public Policy Adm. 2026, 10(1), 80-92. doi: 10.11648/j.jppa.20261001.18
Copy
|
Download
AMA Style
Pingzhong D, Jialing Y. The Spatio-temporal Coupling Coordination and Driving Factors of Population Agglomeration and Urban Resilience. J Public Policy Adm. 2026;10(1):80-92. doi: 10.11648/j.jppa.20261001.18
Copy
|
Download
-
@article{10.11648/j.jppa.20261001.18,
  author = {Duan Pingzhong and Yin Jialing},
  title = {The Spatio-temporal Coupling Coordination and Driving Factors of Population Agglomeration and Urban Resilience},
  journal = {Journal of Public Policy and Administration},
  volume = {10},
  number = {1},
  pages = {80-92},
  doi = {10.11648/j.jppa.20261001.18},
  url = {https://doi.org/10.11648/j.jppa.20261001.18},
  eprint = {https://article.sciencepublishinggroup.com/pdf/10.11648.j.jppa.20261001.18},
  abstract = {This study employs a coupling coordination model to explore the coupling coordination level of population agglomeration and urban resilience in 31 provinces of China from 2006 to 2022. Furthermore, grey relational analysis and spatial Durbin model are utilized to investigate the internal and external driving factors that affect the coupling coordination. The main findings are as follows: (1) The overall level of population agglomeration in China has remained relatively stable, while urban resilience has exhibited a steady upward trend. Both indicators are markedly higher in the eastern region compared to other regions. Although the central region demonstrates a higher degree of population agglomeration than the northeast and western regions, its urban resilience is relatively low. (2) The coupling coordination degree between population agglomeration and urban resilience has steadily improved, and it has moved from serious imbalance to mild imbalance. Spatially, the coupling coordination exhibits a descending gradient from the east to the central, northeast, and western regions. (3) Internal driving factors display significant regional heterogeneity. In the eastern region, enhancing economic and infrastructure resilience is of critical importance. In the central region, priority should be given to the improvement of ecological resilience. In the northeast and western regions, efforts should focus on promoting population agglomeration and strengthening both economic and social resilience. Among the external driving factors, marketization level, human capital, and technological innovation all play a promoting role, while government intervention acts as a hindrance. Notably, human capital and technological innovation generate significant positive spatial spillover effects, while improvements in marketization and heightened government intervention tend to produce negative externalities in neighboring regions.},
 year = {2026}
}
Copy
|
Download
-
TY  - JOUR
T1  - The Spatio-temporal Coupling Coordination and Driving Factors of Population Agglomeration and Urban Resilience
AU  - Duan Pingzhong
AU  - Yin Jialing
Y1  - 2026/03/05
PY  - 2026
N1  - https://doi.org/10.11648/j.jppa.20261001.18
DO  - 10.11648/j.jppa.20261001.18
T2  - Journal of Public Policy and Administration
JF  - Journal of Public Policy and Administration
JO  - Journal of Public Policy and Administration
SP  - 80
EP  - 92
PB  - Science Publishing Group
SN  - 2640-2696
UR  - https://doi.org/10.11648/j.jppa.20261001.18
AB  - This study employs a coupling coordination model to explore the coupling coordination level of population agglomeration and urban resilience in 31 provinces of China from 2006 to 2022. Furthermore, grey relational analysis and spatial Durbin model are utilized to investigate the internal and external driving factors that affect the coupling coordination. The main findings are as follows: (1) The overall level of population agglomeration in China has remained relatively stable, while urban resilience has exhibited a steady upward trend. Both indicators are markedly higher in the eastern region compared to other regions. Although the central region demonstrates a higher degree of population agglomeration than the northeast and western regions, its urban resilience is relatively low. (2) The coupling coordination degree between population agglomeration and urban resilience has steadily improved, and it has moved from serious imbalance to mild imbalance. Spatially, the coupling coordination exhibits a descending gradient from the east to the central, northeast, and western regions. (3) Internal driving factors display significant regional heterogeneity. In the eastern region, enhancing economic and infrastructure resilience is of critical importance. In the central region, priority should be given to the improvement of ecological resilience. In the northeast and western regions, efforts should focus on promoting population agglomeration and strengthening both economic and social resilience. Among the external driving factors, marketization level, human capital, and technological innovation all play a promoting role, while government intervention acts as a hindrance. Notably, human capital and technological innovation generate significant positive spatial spillover effects, while improvements in marketization and heightened government intervention tend to produce negative externalities in neighboring regions.
VL  - 10
IS  - 1
ER  -
Copy
|
Download