Most people living in the underserved rural communities in Ghana, do not have access to basic social services, such as portable water, electricity, mobile phones and internet, to promote healthy and productive living. Consequently, this research explores the influence of demographic variables on people access to basic social amenities using the Afrobarometer survey Round 10 data on Ghana. A total of 2,400 respondents were randomly sampled across all districts in the 16 regions. Structured questionnaires were the main instruments used for data collection. The data was analyzed using inferential statistics, such as correlation and multivariate regression analysis to test the hypotheses. The findings show a significant effect of socio-spatial, educational, and gender disparities in access to basic social services in the country. Individual level of education emerged as a strong predictor of access to the internet, mobile phone ownership and portable water. People's location, particularly the rural-urban divide, proved to be a major determinant of access to basic social amenities, while regional inequalities were evident across nearly all the outcome variables. The study recommends positioning education as a central instrument for socio-economic empowerment and civic engagement; targeted, context-specific development planning policies that prioritize expansion of infrastructure and social amenities to underserved communities; bridging the digital divide; and implementation of gender-sensitive digital inclusion strategies to reduce technology access gaps that constrain women's socio-political participation.
| Published in | Social Sciences (Volume 15, Issue 3) |
| DOI | 10.11648/j.ss.20261503.11 |
| Page(s) | 101-117 |
| Creative Commons |
This is an Open Access article, distributed under the terms of the Creative Commons Attribution 4.0 International License (http://creativecommons.org/licenses/by/4.0/), which permits unrestricted use, distribution and reproduction in any medium or format, provided the original work is properly cited. |
| Copyright |
Copyright © The Author(s), 2026. Published by Science Publishing Group |
Basic Social Services, Demographic Characteristics, Digital Divide, Multivariate Analysis, Statistics
Variables | Gender | Location | Region | Educ3 | Relig4 | InterAc | Mob_Ph | Portabl_W | Electricity |
|---|---|---|---|---|---|---|---|---|---|
Gender | 1.0000 | ||||||||
Location_U~r | 0.0009 | 1.0000 | |||||||
0.9666 | |||||||||
REGION | 0.0040 | 0.2488 | 1.0000 | ||||||
0.8450 | 0.0000 | ||||||||
Educ3 | -0.1668 | -0.2592 | -0.2103 | 1.0000 | |||||
0.0000 | 0.0000 | 0.0000 | |||||||
Relig4 | -0.0447 | 0.0677 | 0.2564 | -0.1287 | 1.0000 | ||||
0.0319 | 0.0012 | 0.0000 | 0.0000 | ||||||
InternetAcc | -0.1372 | -0.2729 | -0.1598 | 0.4573 | -0.0871 | 1.0000 | |||
0.0000 | 0.0000 | 0.0000 | 0.0000 | 0.0000 | |||||
Mob_Phone1 | -0.0720 | -0.1407 | -0.1071 | 0.2443 | -0.0604 | 0.3320 | 1.0000 | ||
0.0004 | 0.0000 | 0.0000 | 0.0000 | 0.0038 | 0.0000 | ||||
Portable_W | 0.0009 | -0.4552 | -0.3369 | 0.2167 | -0.1016 | 0.2105 | 0.1082 | 1.0000 | |
0.9655 | 0.0000 | 0.0000 | 0.0000 | 0.0000 | 0.0000 | 0.0000 | |||
Electricity | 0.0000 | -0.2492 | -0.1606 | 0.1311 | -0.0459 | 0.1732 | 0.1190 | 0.2546 | 1.0000 |
1.0000 | 0.0000 | 0.0000 | 0.0000 | 0.0279 | 0.0000 | 0.0000 | 0.0000 |
Source | Statistic | Df | df1 | df2 | F | Sign. | |
|---|---|---|---|---|---|---|---|
Model | W | 0.4140 | 23 | 92 | 8983.5 | 24.37 | 0.0000 |
P | 0.7312 | 92 | 9088 | 22.10 | 0.0000 | ||
L | 1.0929 | 92 | 9070 | 26.94 | 0.0000 | ||
R | 0.7440 | 23 | 2272 | 73.49 | 0.0000 | ||
Residual | 2272 | ||||||
Gender | W | 0.9912 | 1 | 4 | 2269 | 5.06 | 0.0005 |
P | 0.0088 | 4 | 2269 | 5.06 | 0.0005 | ||
L | 0.0089 | 4 | 2269 | 5.06 | 0.0005 | ||
R | 0.0089 | 4 | 2269 | 5.06 | 0.0005 | ||
Location_~r | W | 0.8627 | 1 | 4 | 2269 | 90.24 | 0.0000 |
P | 0.1373 | 4 | 2269 | 90.24 | 0.0000 | ||
L | 0.1591 | 4 | 2269 | 90.24 | 0.0000 | ||
R | 0.1591 | 4 | 2269 | 90.24 | 0.0000 | ||
REGION | W | 0.6976 | 15 | 60 | 8859.3 | 14.27 | 0.0000 |
P | 0.3338 | 60 | 9088 | 13.79 | 0.0000 | ||
L | 0.3898 | 60 | 9070 | 14.73 | 0.0000 | ||
R | 0.2325 | 15 | 2272 | 35.21 | 0.0000 | ||
Educ3 | W | 0.8415 | 3 | 12 | 6003.5 | 33.72 | 0.0000 |
P | 0.1599 | 12 | 6813 | 31.97 | 0.0000 | ||
L | 0.1866 | 12 | 6803 | 35.27 | 0.0000 | ||
R | 0.1769 | 4 | 2271 | 100.43 | 0.0000 | ||
Relig4 | W | 0.9840 | 3 | 12 | 6003.5 | 3.05 | 0.0003 |
P | 0.0160 | 12 | 6813 | 3.04 | 0.0003 | ||
L | 0.0162 | 12 | 6803 | 3.06 | 0.0003 | ||
R | 0.0137 | 4 | 2271 | 7.76 | 0.0000 | ||
Residual | 2272 | ||||||
Total | 2295 | ||||||
W = Wilks' lambda | P = Pillai's trace | L = Lawley-Hotelling trace | R = Roy's largest root | ||||
Equation | Obs | Parms | RMSE | R-sq | F | P>F |
|---|---|---|---|---|---|---|
Internet_acc | 2,296 | 24 | 0.4280 | 0.2586 | 34.4632 | 0.0000 |
Mob_Phone1 | 2,296 | 24 | 0.2489 | 0.0911 | 9.9027 | 0.0000 |
Portable_W~1 | 2,296 | 24 | 0.3871 | 0.3297 | 48.5779 | 0.0000 |
Electricity | 2,296 | 24 | 0.2024 | 0.2121 | 26.5997 | 0.0000 |
Variables | Coefficient | Std. err. | t | P>t | 95% conf. | interval |
|---|---|---|---|---|---|---|
Internet_acc | ||||||
Gender | ||||||
Woman | -0.0772 | 0.0183 | -4.2200 | 0.0000 | -0.1132 | -0.0413 |
Location_Urb_Rur | ||||||
Rural | -0.1202 | 0.0209 | -5.7500 | 0.0000 | -0.1612 | -0.0793 |
REGION | ||||||
WESTERN NORTH | -0.0094 | 0.0634 | -0.1500 | 0.8820 | -0.1337 | 0.1150 |
CENTRAL | -0.0100 | 0.0459 | -0.2200 | 0.8280 | -0.1001 | 0.0801 |
GREATER ACCRA | 0.0619 | 0.0411 | 1.5000 | 0.1330 | -0.0188 | 0.1425 |
VOLTA | -0.1877 | 0.0524 | -3.5800 | 0.0000 | -0.2904 | -0.0850 |
OTI | -0.1175 | 0.0687 | -1.7100 | 0.0880 | -0.2523 | 0.0173 |
EASTERN | -0.0751 | 0.0450 | -1.6700 | 0.0950 | -0.1632 | 0.0131 |
ASHANTI | 0.0421 | 0.0410 | 1.0300 | 0.3050 | -0.0383 | 0.1225 |
AHAFO | -0.1295 | 0.0743 | -1.7400 | 0.0810 | -0.2752 | 0.0162 |
BONO | 0.0919 | 0.0577 | 1.5900 | 0.1110 | -0.0212 | 0.2050 |
BONO EAST | 0.0291 | 0.0585 | 0.5000 | 0.6190 | -0.0857 | 0.1438 |
NORTHERN | -0.1390 | 0.0525 | -2.6500 | 0.0080 | -0.2419 | -0.0361 |
SAVANNAH | -0.1695 | 0.0724 | -2.3400 | 0.0190 | -0.3115 | -0.0275 |
NORTH EAST | -0.0841 | 0.0803 | -1.0500 | 0.2950 | -0.2415 | 0.0734 |
UPPER EAST | -0.1129 | 0.0593 | -1.9000 | 0.0570 | -0.2292 | 0.0033 |
UPPER WEST | -0.1051 | 0.0663 | -1.5800 | 0.1130 | -0.2351 | 0.0250 |
Educ3 | ||||||
Low education | 0.1859 | 0.0334 | 5.5600 | 0.0000 | 0.1204 | 0.2515 |
Medium education | 0.4289 | 0.0306 | 14.0000 | 0.0000 | 0.3688 | 0.4890 |
High education | 0.6497 | 0.0386 | 16.8400 | 0.0000 | 0.5741 | 0.7254 |
Relig4 | ||||||
Muslim | 0.0470 | 0.0265 | 1.7800 | 0.0760 | -0.0049 | 0.0989 |
Traditional | -0.0379 | 0.0581 | -0.6500 | 0.5140 | -0.1518 | 0.0760 |
Other | -0.0769 | 0.0671 | -1.1500 | 0.2520 | -0.2085 | 0.0547 |
_cons | 0.3222 | 0.0481 | 6.7000 | 0.0000 | 0.2278 | 0.4165 |
Variables | Coefficient | Std. err. | T | P>t | 95% conf. | interval |
|---|---|---|---|---|---|---|
Mob_Phone1 | ||||||
Gender | ||||||
Woman | -0.0251 | 0.0107 | -2.3600 | 0.0180 | -0.0460 | -0.0042 |
Location_Urb_Rur | ||||||
Rural | -0.0359 | 0.0122 | -2.9500 | 0.0030 | -0.0597 | -0.0120 |
REGION | ||||||
WESTERN NORTH | 0.0385 | 0.0369 | 1.0400 | 0.2970 | -0.0339 | 0.1108 |
CENTRAL | -0.0311 | 0.0267 | -1.1600 | 0.2450 | -0.0835 | 0.0213 |
GREATER ACCRA | 0.0179 | 0.0239 | 0.7500 | 0.4530 | -0.0290 | 0.0648 |
VOLTA | 0.0347 | 0.0305 | 1.1400 | 0.2550 | -0.0250 | 0.0944 |
OTI | -0.0283 | 0.0400 | -0.7100 | 0.4790 | -0.1067 | 0.0501 |
EASTERN | 0.0256 | 0.0262 | 0.9800 | 0.3270 | -0.0257 | 0.0769 |
ASHANTI | -0.0130 | 0.0239 | -0.5500 | 0.5860 | -0.0598 | 0.0338 |
AHAFO | 0.0143 | 0.0432 | 0.3300 | 0.7410 | -0.0705 | 0.0990 |
BONO | -0.0229 | 0.0336 | -0.6800 | 0.4940 | -0.0887 | 0.0429 |
BONO EAST | 0.0001 | 0.0340 | 0.0000 | 0.9970 | -0.0666 | 0.0669 |
NORTHERN | -0.1123 | 0.0305 | -3.6800 | 0.0000 | -0.1721 | -0.0524 |
SAVANNAH | 0.0458 | 0.0421 | 1.0900 | 0.2770 | -0.0368 | 0.1284 |
NORTH EAST | -0.0879 | 0.0467 | -1.8800 | 0.0600 | -0.1795 | 0.0037 |
UPPER EAST | 0.0096 | 0.0345 | 0.2800 | 0.7800 | -0.0580 | 0.0773 |
UPPER WEST | 0.0366 | 0.0386 | 0.9500 | 0.3430 | -0.0391 | 0.1122 |
Educ3 | ||||||
Low education | 0.1315 | 0.0194 | 6.7600 | 0.0000 | 0.0934 | 0.1697 |
Medium education | 0.1598 | 0.0178 | 8.9700 | 0.0000 | 0.1248 | 0.1947 |
High education | 0.1948 | 0.0224 | 8.6800 | 0.0000 | 0.1508 | 0.2388 |
Relig4 | ||||||
Muslim | 0.0302 | 0.0154 | 1.9600 | 0.0500 | 0.0000 | 0.0603 |
Traditional | -0.0896 | 0.0338 | -2.6500 | 0.0080 | -0.1559 | -0.0234 |
Other | 0.0151 | 0.0390 | 0.3900 | 0.7000 | -0.0615 | 0.0916 |
_cons | 0.8154 | 0.0280 | 29.1500 | 0.0000 | 0.7605 | 0.8703 |
Variables | Coefficient | Std. err. | t | P>t | 95% conf. | interval |
|---|---|---|---|---|---|---|
Portable_Water1 | ||||||
Gender | ||||||
Woman | 0.0102 | 0.0166 | 0.6100 | 0.5400 | -0.0223 | 0.0427 |
Location_Urb_Rur | ||||||
Rural | -0.3126 | 0.0189 | -16.5400 | 0.0000 | -0.3497 | -0.2756 |
REGION | ||||||
WESTERN NORTH | 0.1854 | 0.0574 | 3.2300 | 0.0010 | 0.0729 | 0.2978 |
CENTRAL | 0.2594 | 0.0415 | 6.2400 | 0.0000 | 0.1779 | 0.3409 |
GREATER ACCRA | 0.1356 | 0.0372 | 3.6400 | 0.0000 | 0.0626 | 0.2085 |
VOLTA | -0.0979 | 0.0474 | -2.0700 | 0.0390 | -0.1908 | -0.0050 |
OTI | 0.0054 | 0.0622 | 0.0900 | 0.9300 | -0.1165 | 0.1273 |
EASTERN | 0.0194 | 0.0407 | 0.4800 | 0.6340 | -0.0604 | 0.0991 |
ASHANTI | -0.0999 | 0.0371 | -2.6900 | 0.0070 | -0.1727 | -0.0272 |
AHAFO | -0.4942 | 0.0672 | -7.3600 | 0.0000 | -0.6260 | -0.3625 |
BONO | -0.0080 | 0.0522 | -0.1500 | 0.8790 | -0.1103 | 0.0944 |
BONO EAST | 0.1854 | 0.0529 | 3.5000 | 0.0000 | 0.0815 | 0.2892 |
NORTHERN | -0.2581 | 0.0474 | -5.4400 | 0.0000 | -0.3512 | -0.1651 |
SAVANNAH | -0.2634 | 0.0655 | -4.0200 | 0.0000 | -0.3919 | -0.1350 |
NORTH EAST | -0.2665 | 0.0726 | -3.6700 | 0.0000 | -0.4089 | -0.1241 |
UPPER EAST | -0.2582 | 0.0536 | -4.8100 | 0.0000 | -0.3633 | -0.1530 |
UPPER WEST | -0.2284 | 0.0600 | -3.8100 | 0.0000 | -0.3460 | -0.1108 |
Educ3 | ||||||
Low education | 0.0440 | 0.0302 | 1.4600 | 0.1450 | -0.0153 | 0.1034 |
Medium education | 0.0808 | 0.0277 | 2.9200 | 0.0040 | 0.0265 | 0.1352 |
High education | 0.1207 | 0.0349 | 3.4600 | 0.0010 | 0.0523 | 0.1891 |
Relig4 | ||||||
Muslim | 0.0814 | 0.0239 | 3.4000 | 0.0010 | 0.0345 | 0.1283 |
Traditional | -0.1162 | 0.0525 | -2.2100 | 0.0270 | -0.2192 | -0.0132 |
Other | -0.0094 | 0.0607 | -0.1600 | 0.8760 | -0.1285 | 0.1096 |
_cons | 0.7163 | 0.0435 | 16.4700 | 0.0000 | 0.6310 | 0.8016 |
Variables | Coefficient | Std. err. | T | P>t | 95% conf. | interval |
|---|---|---|---|---|---|---|
Electricity | ||||||
Gender | ||||||
Woman | 0.0008 | 0.0087 | 0.0900 | 0.9300 | -0.0162 | 0.0178 |
Location_Urb_Rur | ||||||
Rural | -0.0956 | 0.0099 | -9.6700 | 0.0000 | -0.1150 | -0.0762 |
REGION | ||||||
WESTERN NORTH | 0.0700 | 0.0300 | 2.3300 | 0.0200 | 0.0112 | 0.1288 |
CENTRAL | 0.0269 | 0.0217 | 1.2400 | 0.2160 | -0.0157 | 0.0695 |
GREATER ACCRA | -0.0021 | 0.0195 | -0.1100 | 0.9120 | -0.0403 | 0.0360 |
VOLTA | 0.0649 | 0.0248 | 2.6200 | 0.0090 | 0.0164 | 0.1135 |
OTI | -0.1887 | 0.0325 | -5.8000 | 0.0000 | -0.2524 | -0.1249 |
EASTERN | 0.0289 | 0.0213 | 1.3600 | 0.1740 | -0.0128 | 0.0706 |
ASHANTI | 0.0082 | 0.0194 | 0.4200 | 0.6730 | -0.0299 | 0.0462 |
AHAFO | -0.2929 | 0.0351 | -8.3300 | 0.0000 | -0.3618 | -0.2240 |
BONO | 0.0488 | 0.0273 | 1.7900 | 0.0740 | -0.0047 | 0.1023 |
BONO EAST | 0.0521 | 0.0277 | 1.8800 | 0.0600 | -0.0022 | 0.1064 |
NORTHERN | -0.0932 | 0.0248 | -3.7600 | 0.0000 | -0.1419 | -0.0445 |
SAVANNAH | -0.4304 | 0.0343 | -12.5600 | 0.0000 | -0.4976 | -0.3632 |
NORTH EAST | 0.0623 | 0.0380 | 1.6400 | 0.1010 | -0.0122 | 0.1367 |
UPPER EAST | -0.0812 | 0.0280 | -2.9000 | 0.0040 | -0.1362 | -0.0262 |
UPPER WEST | 0.0758 | 0.0314 | 2.4200 | 0.0160 | 0.0143 | 0.1373 |
Educ3 | ||||||
Low education | 0.0120 | 0.0158 | 0.7600 | 0.4490 | -0.0190 | 0.0430 |
Medium education | 0.0104 | 0.0145 | 0.7200 | 0.4720 | -0.0180 | 0.0388 |
High education | 0.0162 | 0.0182 | 0.8900 | 0.3740 | -0.0196 | 0.0520 |
Relig4 | ||||||
Muslim | 0.0169 | 0.0125 | 1.3500 | 0.1780 | -0.0077 | 0.0414 |
Traditional | 0.0144 | 0.0275 | 0.5200 | 0.6010 | -0.0395 | 0.0682 |
Other | 0.0311 | 0.0317 | 0.9800 | 0.3270 | -0.0311 | 0.0934 |
_cons | 0.9770 | 0.0228 | 42.9400 | 0.0000 | 0.9323 | 1.0216 |
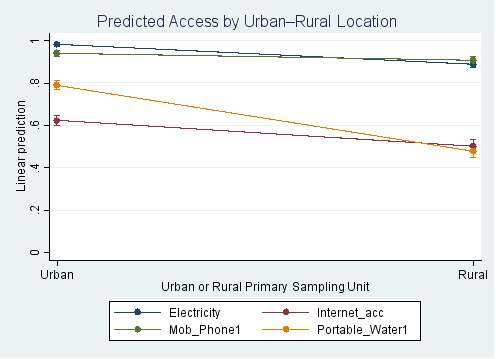
_predict#Location_Urb_Rur | Marginal Effect | Std. Err. | T | P>t | 95% Conf. | Interval |
|---|---|---|---|---|---|---|
1#Urban | 0.6206 | 0.0120 | 51.7100 | 0.0000 | 0.5971 | 0.6441 |
1#Rural | 0.5004 | 0.0157 | 31.9300 | 0.0000 | 0.4696 | 0.5311 |
2#Urban | 0.9410 | 0.0070 | 134.8200 | 0.0000 | 0.9273 | 0.9547 |
2#Rural | 0.9052 | 0.0091 | 99.3200 | 0.0000 | 0.8873 | 0.9230 |
3#Urban | 0.7898 | 0.0109 | 72.7600 | 0.0000 | 0.7685 | 0.8111 |
3#Rural | 0.4772 | 0.0142 | 33.6700 | 0.0000 | 0.4494 | 0.5050 |
4#Urban | 0.9822 | 0.0057 | 173.0000 | 0.0000 | 0.9711 | 0.9934 |
4#Rural | 0.8866 | 0.0074 | 119.6000 | 0.0000 | 0.8721 | 0.9012 |
CDD | Center for Democratic Development |
CP | Capability Theory |
DD | Digital Divide |
DDT | Digital Divide Theory |
ICT | Information and Communication Technology |
IFPRI | International Food Policy Research Institute |
RCT | Resource Conversion Theory |
SDGs | Sustainable Development Goals |
| [1] | Achanso, A. (2020). The Efficacy of Decentralization in promoting Good Governance: A case study of Kpandai District of Northern Ghana. African Social Science and Research Journal. |
| [2] | Abadie, F., & Badu, E. (2023). Digital Connectivity and Development in Ghana: The Role of Demographics in Access to Technology. Journal of African Development, 25(2), 132-150. |
| [3] | Adeosun, O. T., Adebayo, A. A., & Salami, K. K. (2024). Governance quality, democratic institutions and sustainable development outcomes in Sub-Saharan Africa. Sustainable Development, 32(2), 455–468. |
| [4] | Adom, A., & Yeboah, E. (2021). Mobile phone use and its Determinants among University Students in Ghana. Ghana Journal of Technology and Development, 8(4), 67-80. |
| [5] | Agyemang, S., Owusu, K., & Boateng, F. (2020). Inequalities in access to basic social services in Ghana: A spatial and socio-economic analysis. GeoJournal, 85(6), 1563–1579. |
| [6] | Ahmed, S., & Lopez, L. (2023). Bridging the global digital divide: Socioeconomic and infrastructural determinants of internet access. Telecommunications Policy, 47(5), 102537. |
| [7] | Antwi, S., & Agyapong, G. (2022). Disparities in Mobile Phone Ownership and Internet Access in Ghana: Examining the Influence of Socioeconomic factors. Telecommunications Policy, 46(4), 102-115. |
| [8] |
Asante, J. K. (2024). Bridging the digital divide in Ghanaian education: Challenges, opportunities, and the role of technology in enhancing learning outcomes. AfricaJournal of Emerging Issues.
https://ajoeijournal.org/sys/index.php/ajoei/article/view/827 |
| [9] | Bardot, T. (2025). Disparities in drinking water quality across the United States. PLOS. |
| [10] | Boadu, A., & Osei, A. (2020). The Impact of Age on Energy Consumption in Ghana. International Journal of Energy Economics and Policy, 10(3), 158-163. |
| [11] | Boatemaa, S. (2025). Digital inequality in Ghana: Examining rural–urban disparities in access to ICT. Information Development, 41(1), 112–125. |
| [12] | Cagler, A., & Gurler, Z. (2025). Progress towards achieving the sustainable development goals: The role of governance, democracy, and well-being. Discover Sustainability, Springer. |
| [13] | CDD-Ghana. (2025a). Afrobarometer Round 10 survey in Ghana, 2024. Summary of results. |
| [14] | CDD-Ghana. (2025b). Afrobarometer Round 10 Survey Manual (Number July). |
| [15] | DataReportal. (2025). Digital 2025: Ghana. Retrieved from |
| [16] | Electricity Monitor Ghana. (2024). Access to Electricity in Ghana. Retrieved from |
| [17] | Faguet, J. P. (2012). Decentralization and popular democracy: Governance from below in Bolivia: University of Michigan Press. |
| [18] | Ferguson, N., Seymour, G., & Azzarri, C. (2023). Examining the gender digital divide: A case study from rural Kenya (GCAN Policy Note No. 17). Washington, DC: International Food Policy Research Institute. |
| [19] | Financial inclusion and improved water usage among households in Ghana. (2024). BMC Public Health, 24, 1316. |
| [20] | Frederick, B., Abubakari, A., & Duku, M. (2021). Socio-economic factors affecting access to electricity in Ghana. Journal of Sustainable Development in Africa, 23(1), 121–135. |
| [21] | Garcia-Guiliany, J., & De-la-Hoz-Franco, E. (2020). Multiple linear regression model applied to the projection of electricity demand in Colombia. International Journal of Energy Economics and Policy, 10(1), 419–422. |
| [22] | Ghana Statistical Service. (2022). Ghana’s Population and Housing Census: General Report 3G. Accra: Ghana Statistical Service. |
| [23] | Ghana Statistical Service (GSS). (2019). Household Survey on Information and Communication Technology (ICT) in Ghana. Accra: Ghana Statistical Service. Retrieved from |
| [24] | Ghana Statistical Service. (2023). 2023 Annual household income and expenditure survey report. Accra: Ghana Statistical Service. |
| [25] | GSMA. (2024). State of Mobile Connectivity in 2024. London: United Kingdom. The-State-of-Mobile-Internet-Connectivity-Report-2024.Pdf. |
| [26] | International Food Policy Research Institute (IFPRI). (2024). Gender gaps in digital access and use in rural Africa. Washington, DC: IFPRI. |
| [27] | Jacks, B. S., Ajala, O. A., Lottu, O. A., & Okafor, E. S. (2024). Theoretical frameworks for ICT for development: Impact assessment of telecommunication infrastructure projects in Africa and the USA. World Journal of Advanced Research and Review, 21(3), 394-400. |
| [28] | Jallow, I. A., & Tajmouati, S. (2025). Determinants of financial and digital inclusion in West and Central Africa: Evidence from binary models with cross-validation (arXiv preprint). |
| [29] | Johnson, K. (2018). Understanding inequality in access to water in Canada. International Journal of Environmental Research and Public Health, 15(9), 1873. |
| [30] | Jr, J. F. H., Black, W. C., Babin, B. J., Anderson, R. E., Black, W. C., & Anderson, R. E. (2019). Multivariate Data Analysis (Eighth Edi). Cengage Learning EMEA. |
| [31] | Karanja, A. (2019). Ethnic Disparities in Access to Water and Sanitation in Kenya. African Journal of Environmental Science and Technology, 13(6), 137-150. |
| [32] | Kawano, S., Fukushima, T., Nakagawa, J., & Oshiki, M. (2025). Multivariate regression modeling in integrative analysis via sparse regularization. Japanese Journal of Statistics and Data Science. |
| [33] | Kenya National Bureau of Statistics (2020). 2019 Kenya Population and Housing Census. Nairobi: Government of Kenya. |
| [34] | Kyei-Arthur, F. (2024). Prevalence and determinants of Internet use among reproductive aged women in Ghana: Analysis of the 2021 Population and Housing Census. Journal of Environment and Sustainable Development, 3(1), 45-59. |
| [35] | Mahio, L. J. (2022). Examining information and communication technology use in public primary schools in South Africa from the capability approach. Journal of Transdisciplinary Research in Southern Africa, 18(1). |
| [36] | Martínez-Santos, P. (2025). Rural-urban inequality in drinking water accessibility as a socioeconomic outcome in Nigeria. Utilities Policy, 93, 101864. |
| [37] | Matimolane, S., & Mathivha, F. I. (2025). Tackling rural water scarcity in South Africa: climate change, governance, and sustainability pathways. Frontiers in Environmental Science, 13, 1550738. |
| [38] | Mwangi, L., & Njuguna, H. (2022). Demographic Influences on Mobile Phone Accessibility in Rural Kenya. African Journal of Telecommunications, 5(3), 22-34. |
| [39] | Oduro, A. D., Boakye-Yiadom, L., & Baah-Boateng, W. (2020). Gender, time use, and access to water in rural Ghana. Feminist Economics, 26(3), 176–200. |
| [40] | Okorie, I., & Bello, A. (2024). The Role of Socio-Demographic Factors in Internet Access among Nigerian Youth. Nigerian Journal of Communication Studies, 12(1), 101-115. |
| [41] | Omundi, E., & Chitere, P. (2021). Education Level and Water Access: A Case study of Rural Kenya. Global Journal of Water Resource Management, 7(1), 45-58. |
| [42] | Osei, A., Mensah, I., & Nkrumah, F. (2023). Gendered Dimensions of Water and Energy Access in Ghana: The Role of Age in Resource Distribution. Water Resources Management, 37(5), 1509-1525. |
| [43] | PLOS ONE. (2021). Sources of individual differences in adult ICT skills: A large scale empirical test of a new guiding framework, 16(4). |
| [44] | Recica, S., & Tosheva, E. (2023). The welfare state and social democracy: Interaction between social justice policies and democratic governance. Journal of Social Policy Studies. |
| [45] | Sen, A. (1999). Development as freedom. Oxford University Press. |
| [46] | Smith, J., & Thomson, R. (2023). Digital Divide: The Impact of Demographic Factors on Internet Access in the UK. Journal of Digital Inclusion, 15(2), 45-60. |
| [47] |
Statistics Canada. (2019). Potable water use in Canada. Government of Canada.
https://www150.statcan.gc.ca/n1/pub/11-627-m/11-627-m2019022-eng.htm |
| [48] |
The Ghana Report. (2024). Ghana makes progress in water access: GSS Survey. Retrieved from
https://www.theghanareport.com/ghana-makes-progress-in-water.access-gss-survey |
| [49] | Terefe B, Jembere MM, & Assimamaw NT. (2024). Access to drinking safe water and its associated factors among households in East Africa: a mixed effect analysis using 12 East African countries recent national health survey. Journal of Health, Population and Nutrition, 43(1): 72. |
| [50] | van Dijk, J. A. G. M. (2020). The digital divide. Polity Press. |
| [51] | Xie, H. S., Gandla, S. R., Shi, O., & Solanki, P. (2023). Multivariate regression and variance in concrete curing methods: Strength prediction with experiments. Applied Sciences, 13(22), 12239. |
| [52] | Yates, S., Hill, K., Blackwell, C., Davis, A., Padley, M., Stone, E., et al. (2024). A Minimum Digital Living Standard for households with children: Overall findings report (University of Liverpool; Loughborough University; Good Things Foundation). City University Research Repository. |
APA Style
Bariham, I., Nkegbe, W. K. (2026). Exploring the Impact of Demographic Characteristics on Access to Basic Social Services in Ghana: A Multivariate Regression Analysis Approach. Social Sciences, 15(3), 101-117. https://doi.org/10.11648/j.ss.20261503.11
ACS Style
Bariham, I.; Nkegbe, W. K. Exploring the Impact of Demographic Characteristics on Access to Basic Social Services in Ghana: A Multivariate Regression Analysis Approach. Soc. Sci. 2026, 15(3), 101-117. doi: 10.11648/j.ss.20261503.11
@article{10.11648/j.ss.20261503.11,
  author = {Iddrisu Bariham and William Kofi Nkegbe},
  title = {Exploring the Impact of Demographic Characteristics on Access to Basic Social Services in Ghana: A Multivariate Regression Analysis Approach},
  journal = {Social Sciences},
  volume = {15},
  number = {3},
  pages = {101-117},
  doi = {10.11648/j.ss.20261503.11},
  url = {https://doi.org/10.11648/j.ss.20261503.11},
  eprint = {https://article.sciencepublishinggroup.com/pdf/10.11648.j.ss.20261503.11},
  abstract = {Most people living in the underserved rural communities in Ghana, do not have access to basic social services, such as portable water, electricity, mobile phones and internet, to promote healthy and productive living. Consequently, this research explores the influence of demographic variables on people access to basic social amenities using the Afrobarometer survey Round 10 data on Ghana. A total of 2,400 respondents were randomly sampled across all districts in the 16 regions. Structured questionnaires were the main instruments used for data collection. The data was analyzed using inferential statistics, such as correlation and multivariate regression analysis to test the hypotheses. The findings show a significant effect of socio-spatial, educational, and gender disparities in access to basic social services in the country. Individual level of education emerged as a strong predictor of access to the internet, mobile phone ownership and portable water. People's location, particularly the rural-urban divide, proved to be a major determinant of access to basic social amenities, while regional inequalities were evident across nearly all the outcome variables. The study recommends positioning education as a central instrument for socio-economic empowerment and civic engagement; targeted, context-specific development planning policies that prioritize expansion of infrastructure and social amenities to underserved communities; bridging the digital divide; and implementation of gender-sensitive digital inclusion strategies to reduce technology access gaps that constrain women's socio-political participation.},
 year = {2026}
}
TY  - JOUR
T1  - Exploring the Impact of Demographic Characteristics on Access to Basic Social Services in Ghana: A Multivariate Regression Analysis Approach
AU  - Iddrisu Bariham
AU  - William Kofi Nkegbe
Y1  - 2026/05/16
PY  - 2026
N1  - https://doi.org/10.11648/j.ss.20261503.11
DO  - 10.11648/j.ss.20261503.11
T2  - Social Sciences
JF  - Social Sciences
JO  - Social Sciences
SP  - 101
EP  - 117
PB  - Science Publishing Group
SN  - 2326-988X
UR  - https://doi.org/10.11648/j.ss.20261503.11
AB  - Most people living in the underserved rural communities in Ghana, do not have access to basic social services, such as portable water, electricity, mobile phones and internet, to promote healthy and productive living. Consequently, this research explores the influence of demographic variables on people access to basic social amenities using the Afrobarometer survey Round 10 data on Ghana. A total of 2,400 respondents were randomly sampled across all districts in the 16 regions. Structured questionnaires were the main instruments used for data collection. The data was analyzed using inferential statistics, such as correlation and multivariate regression analysis to test the hypotheses. The findings show a significant effect of socio-spatial, educational, and gender disparities in access to basic social services in the country. Individual level of education emerged as a strong predictor of access to the internet, mobile phone ownership and portable water. People's location, particularly the rural-urban divide, proved to be a major determinant of access to basic social amenities, while regional inequalities were evident across nearly all the outcome variables. The study recommends positioning education as a central instrument for socio-economic empowerment and civic engagement; targeted, context-specific development planning policies that prioritize expansion of infrastructure and social amenities to underserved communities; bridging the digital divide; and implementation of gender-sensitive digital inclusion strategies to reduce technology access gaps that constrain women's socio-political participation.
VL  - 15
IS  - 3
ER  -
Department of Humanities and Social Science Education, University for Development Studies, Tamale, Ghana
Department of Statistics, University for Development Studies, Tamale, Ghana
Information