Research Article | | Peer-Reviewed

Evaluating Carbonation-Induced Corrosion Initiation Reliability Index for Reinforced Concrete Sections Exposed to Severe Maximum Temperature Levels

Received: 21 July 2026     Accepted: 3 August 2026     Published: 20 August 2026
Views:       Downloads:
Abstract

The purpose of this research is to evaluate the carbonation depth and the probability of carbonation-induced corrosion initiation (PCICI) values across various temperature levels for concrete mixes, including various percentages of fly ash (FA). The concrete sections are subjected to a combination of severe peak temperatures and CO2 concentrations. Moreover, the maximum temperature levels varied from 25°C to 45°C, reflecting their effects on the diffusion coefficient. The concrete cover (CV) thicknesses used in the probabilistic corrosion model range from 40 mm to 70 mm. The width of the crack (CW) variability ranges from 0.05 to 0.25 mm for cracked sections to determine their effect on probabilistic corrosion initiation. The concrete mixes include various percentages and types of FA, ranging from 5% to 30%, as supplementary cementitious materials (SCMs). The Monte Carlo simulation method is used in conducting the probabilistic corrosion model due to its accuracy. It was deduced that, for a cracked concrete section with a CV of 70 mm and a CW of 0.1 mm, PCICI is significant at 5% when low-calcium fly ash (LCFA) is utilized in the concrete mix, exposed to various severe temperature levels exceeding 30°C. Finally, the impact of using 30% LCFA as SCM poses a high risk on PCICI for uncracked CV of 45 mm, when subjected to maximum temperatures ranging from 35°C to 45°C.

Published in American Journal of Science, Engineering and Technology (Volume 11, Issue 3)
DOI 10.11648/j.ajset.20261103.17
Page(s) 173-185
Creative Commons

This is an Open Access article, distributed under the terms of the Creative Commons Attribution 4.0 International License (http://creativecommons.org/licenses/by/4.0/), which permits unrestricted use, distribution and reproduction in any medium or format, provided the original work is properly cited.

Copyright

Copyright © The Author(s), 2026. Published by Science Publishing Group

Keywords

Maximum Temperature, Relative Humidity, CO2 Concentration, Probability of Corrosion, Cracked Concrete, Crack Width

1. Introduction
Carbonation of concrete cover (CV) is considered a critical durability issue for existing concrete structures in metropolitan environments. Carbonation is the chemical reaction between carbonic acid and calcium ions from calcium hydroxide, calcium silicate hydrates, and calcium aluminate hydrates. CO2 is consumed by the Ca (OH)2 within the concrete, leading to its depletion. This is followed by the consumption of CO2 by the C-S-H and C-A-S to densify the microstructure of cement products. The reactions leading to the formation of calcium carbonate (CaCO3) result in a shrinkage for concrete members exposed to CO2 emission scenarios . As the concentration of atmospheric CO2 increases, the pH value of the concrete is reduced to approximately 9.0 . Then, the steel rebars are exposed to corrosion. Carbonation of concrete depends mainly upon the availability of CO2 and water to form calcium carbonate. Fick’s first law assumes a constant supply of CO2, and the diffusion through the surface of the concrete is constant over time. Diffusion, by its definition, is the mass transportation of CO2 down a concentration gradient. The diffusion of CO2 is based on the steady-state diffusion of CO2 ions in porous materials, as shown in equation (1).
Xct=kt (1)
where: k is the carbonation rate (𝑚𝑚/y), and t is the time of CO2 exposure (years).
Greenhouse gases, particularly CO2 emissions, are the primary driver of global warming . CO2 is the largest contributor to the historical and projected change in radiative forcing, followed by methane and nitrous oxide . Hassaan showed that geopolymer concrete, including nanoparticles, exhibits good resistance to carbonation.
The main influencers for concrete carbonation are the type of cement and its content, the water/cement ratio, and the degree of hydration . The carbonation mechanism for concrete is the integration of physical and chemical processes . The internal factors affecting concrete carbonation are (i.e., cement type, cement content, degree of hydration, (w/c) ratio, types and percentages of supplementary cementitious materials (SCMs), coarse and fine aggregates, chemical admixtures, amount and types of fibers. However, the external factors affecting concrete carbonation are environmental conditions (e.g., CO2 concentration, relative humidity, maximum temperature, freeze-thaw cycles, etc.).
The severe concentration of CO2 in the atmosphere affects the carbonation depth (CD) of concrete. The non-steady state of diffusion using Fick's second law has been the focus of attention in recent literature, as shown in equation (2).
tCCO2=DCO22x2CCO2 (2)
where: DCO2 is the CO2 diffusion coefficient, CCO2 is the atmospheric CO2 concentration measured as%.
Al-Ameeri et al. developed an integrated carbonation model to predict the CD in concrete in different climates based on the properties of concrete, concentrations of CO2, temperature, and relative humidity. The impact of carbonation on the environment has been studied by several researchers . The determination of the carbonation degree based on the pH indicator is considered a simple and effective method. The most known indicator used to observe the CD is phenolphthalein , followed by thymolphthalein, alizarin yellow R, aqueous ethanol, and tropaeolin O. Wang et al. , Seo et al. , Lee et al. , Li and Li, , Steiner et al. , and Silva et al. used phenolphthalein as the main indicator to determine the carbonation front in which concrete is carbonated. The two new reactants, which show color change at a higher pH scale, to prevent the disadvantages of phenolphthalein: (i) alizarine yellow R, and (ii) indigo carmine. These new indicators could give higher accuracy in alkalinity measurement of the partially carbonated zone since they could detect carbonated hazards that the traditional indicator can't distinguish. A non-destructive testing method can also detect the degree of carbonation in concrete, according to Hassaan et al. .
Mineral admixtures act as pozzolanic materials as well as fine fillers; thereby, the microstructure of the hardened cement matrix becomes denser and stronger . Most of the mineral admixtures are involved in the hydration process through the pozzolanic reaction (Pozzolan + Ca (OH)2 +H2OC-S-H, in which C-S-H is the calcium silicate hydrate. The FA presence in concrete may accelerate carbonation and increase the carbonated zone . This relates to the shortage of Ca (OH)2 used for the pozzolanic reaction, which affects a deeper diffusion of CO2 due to the concentration gradient. However, the addition of FA prevents the penetration of free chloride ions into concrete and reduces the corrosion of steel rebar, leading to higher durability. This property is inhibition, which relates to the denser microstructure of the cement paste due to the physical effect of fine grains of ash.
The Monte Carlo simulation (MCS) was utilized in different research to determine the probability of carbonation/chloride-induced corrosion at different times of exposure as a reliable tool due to its high accuracy compared to other reliability methods .
The main problem for the current research is the increase in the maximum temperature levels and CO2 concentrations due to climate change. The increase in the combined effect of maximum temperature levels and CO2 concentrations will lead to a significant increase in the CD, a reduction in the durability of concrete structure members, and serviceability of concrete members. The research gap assesses the optimum percentage of either high- or low-calcium FA that can sustain the combined impact of severe CO2 concentrations and maximum temperature levels for uncracked and cracked concrete sections having various crack widths (CW) across various CVs at different times of exposure. This research aims to assess the probability of corrosion and the reliability index for concrete sections subjected to a combination of severe maximum temperature levels and CO2 concentrations applied on the top part of the uncracked and cracked concrete sections across different CVs. The concrete sections are composed of various percentages and types of fly ash (FA). The research novelty is to find the projection of the CD values, which are subjected to different maximum temperature levels for the uncracked and cracked concrete sections, including various types and percentages of FA. Furthermore, assessing a range of CVs on the probability of carbonation-induced corrosion initiation (PCICI) for different concrete sections, including various percentages of either high- or low-calcium FA, subjected to the impact of various temperature levels at different times of exposure. Finally, assessing the optimum percentages of either high- or low-calcium FA utilized in uncracked and cracked concrete sections with a constant CV, subjected to severe maximum temperature levels and CO2 concentration.
2. Research Methodology
The projection of the CD using the Papadakis and Tsimas model for uncracked concrete and the Al Ameeri et al. model for cracked concrete sections is discussed below.
Papadakis and Tsimas proposed an empirical equation to calculate the effective diffusivity of CO2 (De, CO2) in concrete based on the amount of water, amount of cement, amount of supplementary cementitious materials utilized in the mix, densities of water and cement, as illustrated in equation (3). Moreover, equation (3) considers the impact of relative humidity. Moreover, relative humidity impacts the diffusivity of CO2 penetration inside the concrete.
De,CO2=6.1×10⁻⁶×w-0.267C-0.267 kP1000C+kPρc+wρw3×f(RH) (3)
Where: w is the water content in fresh concrete (kg/m3), C is the cement content (kg/m3), (ρc) is the density of cement and it was assumed to equal 3100 kg/m3 according to Papadakis and Tsimas, , k is the efficiency factor for FA type; where ((FH): is high-calcium FA was set at 0.7 and low calcium FA was set at 0.5; P is the amount of supplementary cementing materials used in concrete (kg/m3) and f (RH) is the relative humidity factor.
According to equations (4) and (5), it was found that as the percentage of both high calcium fly ash (HCFA) and low calcium fly ash (LCFA) increases in the concrete mix, the effective diffusion coefficient of CO2 increases. The relative humidity is assumed to be equal to 70% to calculate the effective diffusion coefficient of CO2, and the cement content used for the existing concrete member is assumed to be equal to 460 kg/m3. Hassan et al. showed that the relationship between the effective diffusion coefficient for CO2 based on equations (4) and (5) at different percentages for the FA is a second-degree polynomial function for HCFA and LCFA. Second-degree polynomial functions were deduced from the least squares regression method to obtain equations of the effective diffusion coefficient for CO2 as a function of various FA types and percentages ranging from 0% to 30% as SCM with the total amount of cement (C=460 kg/m3) used in the concrete mix for concrete sections according to Hassan et al. .
De,CO2=(6×10-13×(%FA)2)+(6×10-11×(%FA))+3×10⁻⁹(4)
De,CO2=(2×10-12×(%FA)2)+(9×10-11×(%FA))+3×10⁻⁹(5)
% of FA ranges from 0% to 30%.
Equations (6) and (7) allowed the prediction of the depth of the carbonation, for the uncracked concrete according to Papadakis and Tsimas , and for cracked concrete according to Al Ameeri et al. , respectively.
xc(t)=2 De,CO2 ×(CO2/100)× t0.218×(C+kP) (6)
where: De, CO2 is the effective diffusion coefficient of CO2 (m2/s); CO2 is the CO2 content in the ambient air at the concrete surface (%).
For cracked concrete, cracks lead to faster carbonation, quantified by Al Ameeri et al. , at which the CW in equation (7) ranges from 0.05 mm to 0.35 mm.
Xc (t)=(11.4×CW+1)×2 De,CO2 ×(CO2/100)× t0.218×(C+kP) (7)
The Arrhenius equation is modified as shown in equation (8) using an adjustment factor (b), which is calculated from the experimental data for cracked prisms using non-linear regression analysis according to Al Ameeri et al. .
f T=expUcR×b×1Tr-1T(8)
Where: b is the adjustment factor, equal to (0.322), UC is the diffusion of activation energy for CO2 diffusing in concrete, R is the gas constant (8.314 J/mole. K), Tr is 298 K, and T is the real temperature (K).
The parameters used for probabilistic corrosion models in the performance function to predict the PCICI, for the uncracked and cracked concrete, are defined in this study according to Hassan et al. . Moreover, the W/C ratio used in the uncracked and cracked concrete sections is set at 0.4. The total amount of cement used in the concrete mix is 460 kg/m3. Moreover, the amount of SCMs across various percentages of FA content in the concrete mix is defined according to Hassan et al. .
The MCS method was utilized in this research to assess the PCICI across various maximum temperature levels for concrete mixes, including various percentages and types of FA in different concrete sections.
3. Analysis of Results
3.1. Validation of the CD and PCICI for the Uncracked Concrete Section
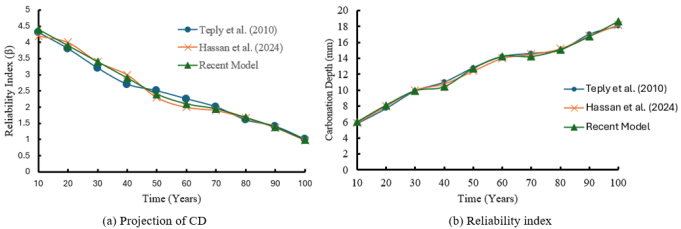
The projection of the CD values versus future years was validated and compared in this research with the results of the CDs over time conducted by Teply et al. and Hassan et al. . Moreover, the recent CD model used in the validation is based mainly on Papadakis and Tsimas's carbonation model. The results obtained from the validation model were compared to the results obtained by Teply et al. and Hassan et al. for LCFA as an SCM in concrete mixes. Furthermore, the recent model utilized for the validation deals with the uncertainty of the random variables, as in the Teply et al. and Hassan et al. probabilistic carbonation-induced corrosion model. Therefore, the recent CD model and probabilistic corrosion model coincide with the results obtained from Teply et al. and Hassan et al. , which proves the robustness of the recent model, as shown in Figure 1.
Figure 1. Comparison of the recent CD and reliability index across various times of CO2 exposure with different resources.
3.2. Impact of Severe Temperature on the CD of Concrete Sections, for Mixes, Including Various Percentages and Types of FA
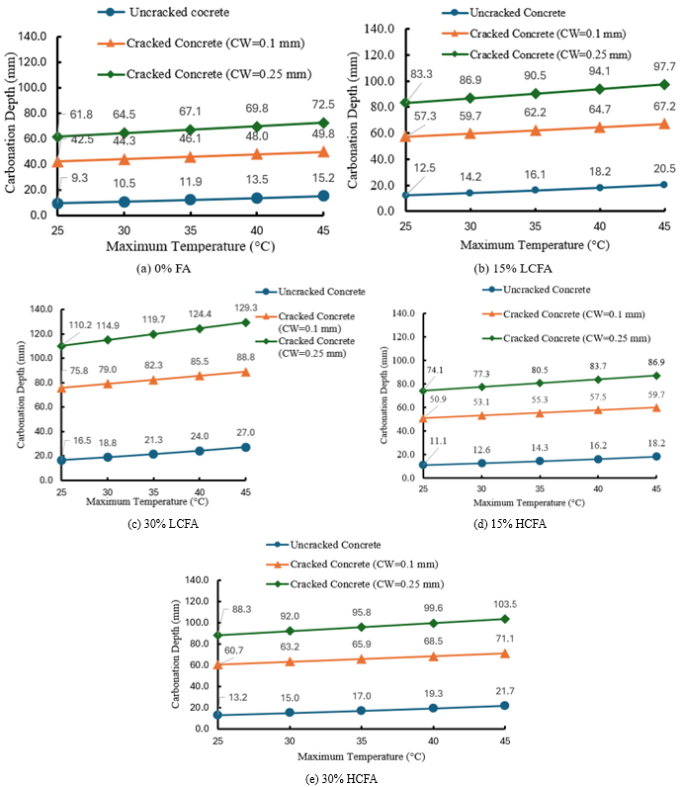
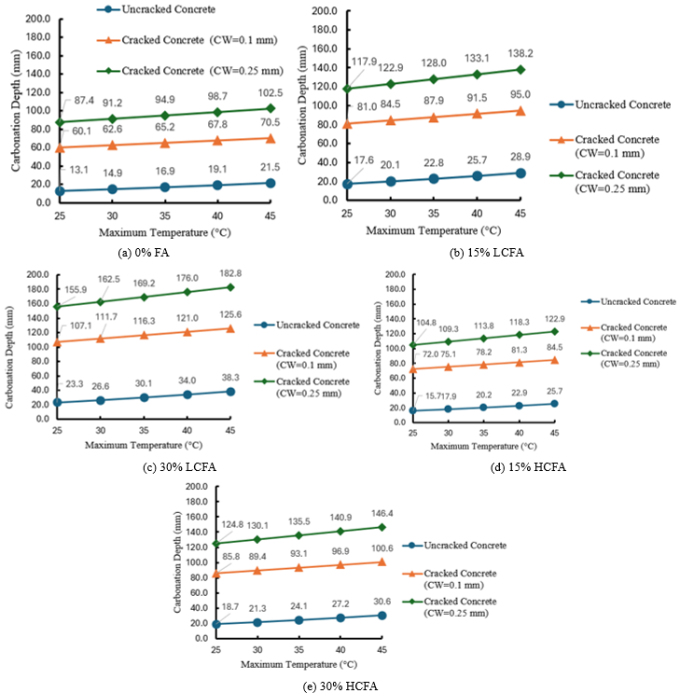
The impact of various maximum temperature levels varying from 25°C to 45°C on the CD of concrete was studied using the Al-Ameeri et al. mathematical model for cracked concrete with various CWs and uncracked concrete sections composed of multiple types and percentages of FA. The impact of the maximum temperature value on the effective diffusion coefficient for CO2 is modeled using the Arrhenius law. The impact of various CWs is considered as a factor for cracked concrete sections, affecting the projection of the CD values across maximum temperature levels. Moreover, the CWs used in the projection of the CDs are 0.1 mm and 0.25 mm to observe their effect on the CD, including various percentages and types of FA. Figure 3 and Figure 4 show the projection of the CD values across various maximum temperature values at a certain time of CO2 exposure equal to 100 years, for concrete members exposed to 500 PPM and 1000 PPM of CO2, respectively. For uncracked concrete, it was deduced that the CD increased slightly when the maximum temperature changed from 25 to 45°C at various FA percentages utilized as SCMs in concrete mixes, as shown in Figures 3 and 4. However, for cracked concrete, it was observed that the projected CD increased sharply compared to the uncracked concrete CD across different maximum temperature levels (see Figure 3 and Figure 4).
Figure 2. Impact of various temperature values on the concrete CD for concrete sections subjected to a CO2 concentration of 500 PPM.
A first-degree polynomial function (i.e., based on the root mean square error) was deduced between the projection of the CD values, for uncracked and cracked concrete sections, and maximum temperature levels across different percentages and types of FA, as shown in Tables 1 and 2.
Table 1. Polynomial functions for predicting CD as a function of the maximum temperature levels for various concrete sections subjected to a CO2 concentration of 500 PPM at T= 100 years of exposure.

% FA

Various Concrete Sections

Uncracked Concrete

Cracked Concrete (CW=0.1 mm)

Cracked Concrete (CW=0.25 mm)

0% FA

CD=(0.2958×T)+1.7242

(R2=0.997)

CD=(0.3667×T)+33.306

(R2=1)

CD=(0.5336×T) +48.458

(R2=1)

15% HCFA

CD=(0.3546×T)+2.0673

(R2=0.997)

CD=(0.4397×T)+ 39.934

(R2=1)

CD=(0.6398×T)+58.102

(R2=1)

30% HCFA

CD=(0.4223×T)+2.4617

(R2=0.997)

CD=(0.5236×T)+ 47.552

(R2=1)

CD=(0.7618×T)+ 69.186

(R2=1)

15% LCFA

CD=(0.3987×T)+2.3245

(R2=0.997)

CD=(0.4944×T)+44.902

(R2=1)

CD=(0.7193×T)+ 65.329

(R2=1)

30% LCFA

CD=(0.5274×T)+3.0745

(R2=0.997)

CD=(0.6539×T) + 59.389

(R2=1)

CD=(0.9514×T) + 86.407

(R2=1)

Where: CD is the carbonation depth value (mm), T is the maximum temperature level, ranging from 25°C to 45°C.
Figure 3. Impact of various severe temperature values on the CD for concrete sections exposed to a CO2 concentration of 1000 PPM.
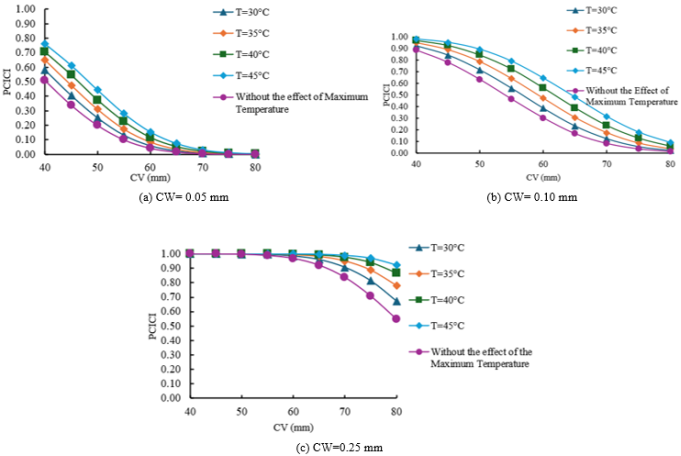
Table 2. Polynomial functions for predicting the CD as a function of the maximum temperature levels for various concrete sections subjected to a CO2 concentration of 1000 PPM at T= 100 years of exposure.

% FA

Various Concrete Sections

Uncracked Concrete

Cracked Concrete (CW=0.1 mm)

Cracked Concrete (CW=0.25 mm)

0% FA

(0.4183×T)+2.4384

(R2=0.997)

(0.5186×T)+47.101

(R2=1)

(0.7546×T)+ 68.53

(R2=1)

15% HCFA

(0.5015×T) + 2.9236

(R2=0.997)

(0.6218×T) + 56.475

(R2=1)

(0.9047×T)+ (82.168)

(R2=1)

30% HCFA

(0.5972×T)+3.4814

(R2=0.997)

(0.7405×T)+ 67.249

(R2=1)

(1.0774×T) + 97.844

(R2=1)

15% LCFA

(0.5639×T) + 3.2873

(R2=0.997)

(0.6992×T)+63.501

(R2=1)

(1.0173×T)+ 92.39

(R2=1)

30% LCFA

(0.7458×T)+4.348

(R2=0.997)

(0.9248×T) + 83.989

(R2=1)

(1.3455×T)+122.2

(R2=1)

Where: CD is the carbonation depth value (mm), T is the maximum temperature level, ranging from 25°C to 45°C.
3.3. Influence of CVs on the PCICI for Concrete Sections, Including Percentages and Types of FA, Subjected to Temperature Levels
The performance function for cracked concrete is generated using the mathematical model by Al Ameeri et al. , which accounts for the effect of maximum temperatures on the effective diffusion coefficient of CO2. Moreover, CO2 is equal to 1000 PPM in the conductance of the PCICI analysis across various maximum temperature values at 100 years of CO2 exposure. For concrete mixes including 0% FA utilized in the concrete sections, it was deduced that the impact of various maximum temperature values ranging from 30°C to 45°C applied on the concrete sections has a significant impact on the PCICI at a cracked CV of 60 mm or less, and also as the CWs change from 0.05mm to 0.25 mm, as shown in Figure 4. It was observed that a CW of 0.05 mm or less and a CV of 70 mm or more have a negligible impact on the PCICI, regardless of the maximum temperature level, as shown in Figure 4. However, as the CW exceeded 0.05 mm and the CV for concrete sections varied from 40 mm or less to 75 mm, this would have a severe impact on the PCICI, as the maximum temperature exceeded 30°C, as shown in Figure 4. Finally, increases in the percentages of either HCFA or LCFA above 1%, accompanied by rising maximum temperature levels, will reduce the service life and durability of vital concrete structures.
Figure 4. The effect of various cracked CVs having different widths in concrete sections on the probability of corrosion initiation for a concrete member subjected to the impact of different maximum temperature levels.
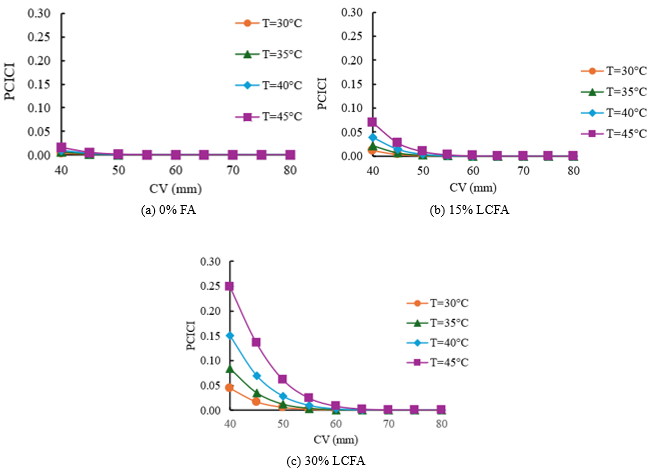
The performance function is conducted for uncracked concrete using the mathematical model by Al Ameeri et al. , which considers the impact of temperatures on the effective diffusion coefficient of CO2. CO2 is assumed in the probabilistic model to be equal to 1000 PPM across various temperature values at t= 100 years of exposure. For different concrete mixes including (0% FA, 15% LCFA, and 30% LCFA) used in the concrete members, it was observed that the impact of various temperature levels ranging from 30°C to 45°C applied on the concrete members, separately, has a negligible effect on the PCICI for unracked CV of 40 mm including 0% FA in its concrete mix, as shown in Figure 5(a). The impact of 30% of LCFA utilized as SCM in the concrete mix has a severe impact on PCICI for uncracked CV of 40 mm and 45 mm when it is subjected to temperature levels varying from 35°C to 45°C or beyond, as shown in Figure 5(c).
Figure 5. Effect of various CVs used in uncracked concrete members on the probability of corrosion initiation for concrete mix, including various percentages of LCFA, exposed to the effect of various temperature levels.
3.4. Impact of Percentages of FAs on the PCICI for Various Concrete Sections, Subjected to Maximum Temperature Levels
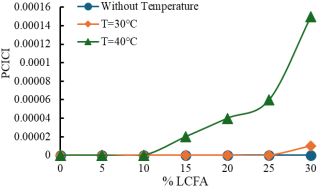
Figure 6. Impact of various percentages of LCFA on the PCICI for uncracked concrete sections subjected to the impact of severe temperature levels.
The PCICI is conducted for uncracked concrete across various percentages of LCFA using the mathematical model proposed by Al Ameeri et al. , considering the impact of maximum temperatures on the effective diffusion coefficient of CO2. For an uncracked concrete section having a CV of 70 mm subjected to the effects of CO2 equal to 1000 PPM at 100 years of exposure, it was observed that the impact of various temperatures for either 30°C or 40°C on the PCICI (PCICI almost equal to zero values) is negligible across various percentages of LCFA, as shown in Figure 6.
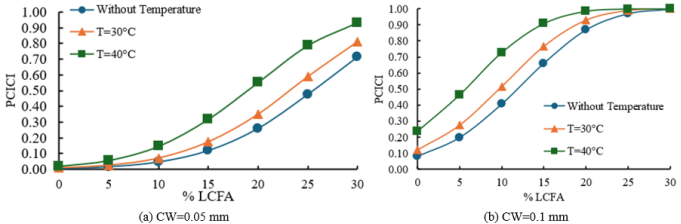
Figure 7 shows that the impact of 30% LCFA utilized in the concrete mixes for cracked concrete sections with CWs of either 0.05 mm or more has a severe impact on the PCICI, regardless of the temperature value of either 30°C or 40°C. It was deduced that the impact of 0.5% to 5% of LCFA as SCMs in the concrete mix had a negligible effect on the PCICI for concrete members subjected to a maximum temperature of either 30°C or 40°C for a cracked CV of 70 mm having a CW of 0.05 mm or less, as shown in Figure 7(a). However, in the case of a CW of 0.1 mm, the PCICI is significant at 5% or more of LCFA, and when the temperature exceeds 30°C on the upper part of the concrete member (see Figure 7(b)). Figure 8 shows the decreasing trend of the reliability index as the percentages of LCFA change from 5% to 30% in concrete mixes that are subjected to different temperature levels.
Figure 7. Effect of various percentages of LCFA on the PCICI for cracked concrete members having various CWs.
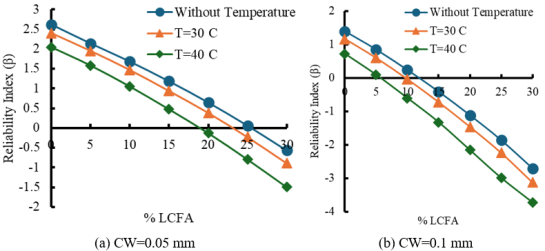
Figure 8. Impact of various percentages of LCFA on the reliability index for cracked concrete sections having various CWs.
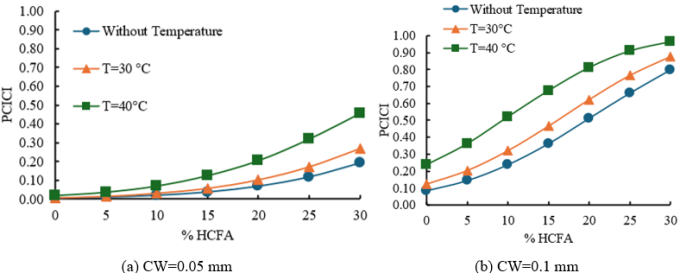
The change of the HCFA from 0% to 30% used in the concrete mixes for cracked concrete members with CWs of 0.05 mm led to an increase in the PCICI from 0.73% to 27% and from 2% to 45.4% when the concrete member is subjected to temperature values of 30°C and 40°C, respectively, as shown in Figure 9(a). Moreover, the increase of the HCFA from 0% to 30% used in the mixes for cracked concrete members with CWs of 0.10 mm, led to a sharp increase in the PCICI from 12% to 87.7% and from 23.7% to 96.5% when the concrete member is subjected to temperature values of 30°C and 40°C, respectively, as shown in Figure 9(b). Therefore, the impact of HCFA has a low significant impact on the PCICI at various cracked concrete sections having different CWs compared with the same percentages of LCFA used in the mix. The difference between the LCFA and HCFA reached a maximum value of 54.25% and 47.9% at 30% of FA, when the cracked concrete surface with a 0.05 mm width is subjected to 30°C and 40°C of temperature, respectively. For cracked concrete with a 0.1 mm width subjected to temperature values of 30°C and 40°C, it was observed that the difference between the LCFA and HCFA reached a maximum value of 12.24% and 3.52% at 30% of FA, respectively. Figure 10 shows the decreasing trend of the reliability index as the percentages of HCFA change from 5% to 30% in concrete mixes that are subjected to different maximum temperature levels.
Figure 9. Effect of various percentages of HCFA on the PCICI for the concrete members having various CWs, subjected to various temperature levels.
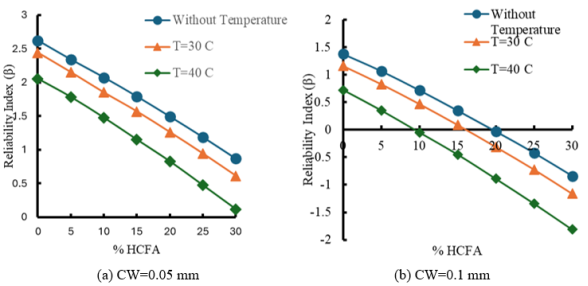
Figure 10. Impact of various percentages of HCFA on the β for cracked concrete sections with various CWs.

4. Conclusions
1) First-degree polynomial functions were deduced between the projection of the carbonation depth values, for uncracked and cracked concrete sections, and maximum temperature levels across different percentages and types of FA used as SCMs in the concrete mix.
2) A cracked concrete cover of 70 mm, having a CW of 0.05 mm, has a negligible impact on the PCICI, regardless of various maximum temperature levels that impact concrete sections that include zero percentage of FA.
3) As the CW increased beyond 0.05 mm for the cracked concrete cover sections that varied in thickness from 40 mm to 75 mm, it would lead to a severe impact on the PCICI, as the maximum temperature increased beyond 30°C, impacting the concrete section that consists of 0% of FA.
4) The increase in percentages of either HCFA or LCFA by a percentage beyond 1%, accompanied by the rise in the maximum temperature levels above 30°C, will lead to a reduction in the durability of cracked concrete.
5) The impact of 30% of LCFA utilized as SCM in the concrete mix has a severe impact on PCICI, for an uncracked concrete cover of 45 mm, when it is subjected to maximum temperature levels ranging from 35°C to 45°C.
6) For an uncracked concrete cover of 70 mm subjected to the combination effects of CO2 equal to 1000 PPM at a 100-year CO2 exposure, and the impact of various temperature levels of either 30°C or 40°C has a negligible impact on the PCICIs across various percentages of LCFA.
7) The impact of 0.5% to 5% of LCFA as SCMs in the concrete mix had a negligible impact on the PCICI for cracked concrete cover of 70 mm having a CW of 0.05 mm or less, when it is subjected to a maximum temperature of either 30°C or 40°C. However, in the case of a cracked concrete section with a CW of 0.1 mm or more, the PCICI is significant at 5% of LCFA, and when the upper part of the concrete cover is subjected to maximum temperature levels exceeding 30°C.
8) Finally, the influence of HCFA has a low significant impact on the PCICI at various cracked concrete sections having different CWs compared with the same percentages of LCFA used in the mix.
Limitations and Recommendations: The total amount of cement used in various concrete mixes is 460 kg/m3. The percentages of either high or low calcium FA vary from 5% to 30% as SCMs, with the total amount of cement used in the concrete mix. RH% is assumed to be equal to 70% in most of the carbonation models. Furthermore, the temperature levels vary from 25°C to 45°C, impacting their effect individually on the effective diffusion coefficient for CO2. Moreover, the CO2 concentration is assumed to be 1000 parts per million in most carbonation-depth models and in probability-of-corrosion models. The CWs range from 0.05mm to 0.25 mm in the cracked concrete cover. The CV is assumed to be equal to 70 mm, dealing with the uncertainty, in the probabilistic corrosion model.
For uncracked concrete sections, it is recommended to provide concrete cover beyond 65 mm and reduce the LCFA content below 30% as SCM when subjected to a CO2 concentration of 1000 PPM and a temperature of 40°C. For cracked concrete sections, with a concrete cover equal to 70 mm having a CW of 0.05 mm, it is recommended to lower the percentages of LCFA below 5% as SCM with the total amount of cement used in the concrete mix for concrete sections subjected to a combination of a temperature of 40°C and a CO2 concentration of 1000 PPM.
Abbreviations

CD

Carbonation Depth

CV

Concrete Cover

CW

Crack Width

FA

Fly Ash

HCFA

High Calcium Fly Ash

LCFA

Low Calcium Fly Ash

MCS

Monte Carlo Simulation

PCICI

Probability of Carbonation-Induced Corrosion Initiation

PPM

Parts Per Million

SCMs

Supplementary Cementitious Materials

Author Contributions
Mostafa Hassan: Conceptualization, Data curation, Formal Analysis, Funding acquisition, Investigation, Methodology, Project administration, Resources, Software, Supervision, Validation, Visualization, Writing – original draft, Writing – review & editing
Conflicts of Interest
The authors declare no conflicts of interest.
References
[1] Neville, A. M., 2011. Properties of Concrete, fifth ed., Pearson Education Limited, London.
[2] Bouchaala, F., Payan, C., Garnier, V., Balayssac, J. P., 2011. Carbonation assessment in concrete by nonlinear ultrasound. Cement and Concrete Research, 41, pp. 557-559,
[3] Jedidi, M., Belhassen, A., 2020. Carbonation of Reinforced Concrete Structures. Current Trends in Civil and Structural Engineering, 5(2),
[4] Mahmood, M., Khan, A. R., Ayub, T., 2022. Carbonation Resistance in Ordinary Portland Cement Concrete with and without Recycled Coarse Aggregate in Natural and Simulated Environment. Sustainability, 14 (1).
[5] Gu, H., Li, Q., 2022. Updating deterioration models of reinforced concrete structures in a carbonation environment using in-situ inspection data. Structure and Infrastructure Engineering, 18(2), 266-277.
[6] Aminzadegan, S., Shahriari, M., Mehranfar, F., 2022. Factors affecting the emission of pollutants in different types of transportation: A literature review. Energy Reports, 8, 2508-2529.
[7] Collins, M., Knutti, R., Arblaster, J., Dufresne, J. L., Fichefet, T., Friedling, S. P., Gao, X., Gutowski, W. J., Johns, T., Krinner, G., Shongwe, M., Tebaldi, C., Weaver, A. J., Wehner, M., 2013. Long-term climate change: projections, Commitments, and irreversibility in Climate Change, The Physical Science Basis (Contribution of Working Group I to the Fifth Assessment Report of the Intergovernmental Panel on Climate Change), Cambridge University Press, Cambridge, United Kingdom, and New York, USA, 1029-1136.
[8] Hassaan, M., 2025. Mechanical Properties of Hardened Geopolymer Concrete Mixes Including Nano Particles: A Comprehensive Review. International Journal of Recent Technology and Engineering (IJRTE), 14 (3), 30-37.
[9] Jiang, L., Lin, B., Cai, Y., 2000. A model for predicting carbonation of high-volume fly ash concrete, Cement and Concrete Research, 30(5), 699-702.
[10] Al Fuhaid, A. F., Niaz, A., 2022. Carbonation and Corrosion Problems in Reinforced Concrete Structures. Buildings, 12(5), 586.
[11] Tongaria, K., Mandal, S., Mohan, D., 2018. A Review on Carbonation of Concrete and Its Prediction Modelling, Journal of Environmental Nanotechnology, 7(4), 76-91,
[12] Al-Ameeri, A. S., Rafiq, M. I., Tsioulou, O., 2021. Impact of climate change on the carbonation in concrete due to carbon dioxide ingress: Experimental investigation and modeling. Journal of Building Engineering, 44, 102594.
[13] Yoon, I.-S., Çopuroğlu, O., Park, K.-B., 2007. Effect of global climatic change on carbonation progress of concrete. Atmospheric Environment, 41(34), 7274-7285.
[14] Stewart, M. G., Wang, X., Nguyen, M. N., 2011. Climate change impact and risks of concrete infrastructure deterioration, Engineering Structures, 33(4), 1326-1337.
[15] Hassan, M., Amleh, L., Othman, H., 2022. Effect of Different Cement Content and Water-Cement Ratio on Carbonation Depth and Probability of Carbonation-Induced Corrosion for Concrete. Cement Wapno Beton, 27, 126-143.
[16] Qiu, Q., 2020. A state-of-the-art review on the carbonation process in cementitious materials: Fundamentals and characterization techniques, Construction and Building Materials, 247, 118503,
[17] Wang, J., Su, H., Du, J., 2018. Influence of coupled effects between flexural tensile stress and carbonation time on the carbonation depth of concrete, Construction and Building Materials, 190, 439-451.
[18] Seo, J., Kim, S., Park, S., 2021. Carbonation of calcium sulfoaluminate cement blended with blast furnace slag, Cement and Concrete Composites. 118, 103918.
[19] Lee, H. J., Kim, D. G., Lee, J.-H., et al. 2012. A study for carbonation degree on concrete using a phenolphthalein indicator and Fourier-Transform Infrared Spectroscopy. International Journal of Civil and Environmental Engineering, 6(2), 95-101.
[20] Li, Z., Li, S., 2020. Effects of wetting and drying on alkalinity and strength of fly ash/slag-activated materials. Construction and Building Materials, 254, 119069.
[21] Steiner, S., Lothenbach, B., Proske, T., 2020. Effect of relative humidity on the carbonation rate of portlandite, calcium silicate hydrates, and ettringite, Cement and Concrete Research, 135, 106116.
[22] Silva, B. A., Ferreira Pinto, A. P., Gomes, A., 2021. Effects of natural and accelerated carbonation on the properties of lime-based materials, Journal of CO2 Utilization, 49, 101552.
[23] Hassaan, M., Elmasry, M. I., and El Ashkar, N., 2021. Structural Health Monitoring for Reinforced Concrete Containment Using Inner Electrical Resistivity Method. Open Journal of Civil Engineering, 11, 317-341.
[24] Hassan, K. E., Cabrera, J. G., and Maliehe, R. S., 2000. The effect of mineral admixtures on the properties of high-performance concrete. Cement and Concrete Composites, 22 (4), 267-271.
[25] Khunthongkeaw, J., Tangtermsirikul, S., Leelawat, T., 2006. A study on carbonation depth prediction for fly ash concrete. Construction and Building Materials, 20 (9), 744-753.
[26] Hassan, M., Amleh, L., Hussein, L., 2024. Projection of the Carbonation Depths and its Probability of Corrosion Initiation for the Uncracked and Cracked Concrete. International Review of Civil Engineering (IRECE), 15, 381-398.
[27] Hassan, M., 2025. Evaluating the Durability of RC Bridges Under Climate Scenarios: A Study of Carbonation and Chloride-induced Corrosion, Toronto Metropolitan University, Ph.D. Thesis.
[28] Hassan, M., 2025. Assessment of Temperature Levels on the Probability of Corrosion for RC Decks Made of Various Percentages of Supplementary Cementitious Materials. SSRG International Journal of Civil Engineering, 12 (11), 36-54.
[29] Hassan, M., 2025. Carbonation of Reinforced Concrete Sections Containing Various Supplementary Cementitious Materials: A Review. Journal of Building Material Science, 7(4), 142-161.
[30] Hassan, M., 2025. Influence of Various Relative Humidity and Chloride Concentrations on Probability of Corrosion for Reinforced Concrete Members: A Review, High Technology Letters, 31 (12), 21-34.
[31] Hassan, M., Amleh, L., 2025. Influence of Various Crack Widths in RC Bridge Decks on the Initiation of Chloride-Induced Corrosion. Journal of Composites Sciences, 9, 242.
[32] Amleh, L., Hassan, M., Hussein, L., 2024. Influence of Climate Change on the Probability of Chloride-Induced Corrosion Initiation for RC Bridge Decks Made of Geopolymer Concrete. Sustainability, 16, 8200.
[33] Hassan, M., Amleh, L., 2024. Influence of Climate Change on Probability of Carbonation-Induced Corrosion Initiation. Periodica Polytechnica Civil Engineering Journal, 68, 57-67.
[34] Hassan, M., 2026. Comparative Assessment of Chloride-Induced Corrosion Probability in RC Decks Using Monte Carlo Simulation and an Approximate Algorithm Method. In: Chee, C. Y., Wang, C. (eds) Proceedings of the 9th International Conference on Materials Engineering and Nanotechnology. ICMEN 2025. Springer Proceedings in Materials, 2026; 122. Springer, Singapore.
[35] Papadakis, V. G., Tsimas, S., 2002. Supplementary cementing materials in Concrete Part I: efficiency and design. Cement and Concrete Research, 32, 1525-1532.
[36] Teplý, B., Chromá, M., Rovnaník, P., 2010. Durability assessment of concrete structures: reinforcement de-passivation due to carbonation, Structure and Infrastructure Engineering, 6(3), 317-327.
Cite This Article
  • APA Style

    Hassan, M. (2026). Evaluating Carbonation-Induced Corrosion Initiation Reliability Index for Reinforced Concrete Sections Exposed to Severe Maximum Temperature Levels. American Journal of Science, Engineering and Technology, 11(3), 173-185. https://doi.org/10.11648/j.ajset.20261103.17

    Copy | Download

    ACS Style

    Hassan, M. Evaluating Carbonation-Induced Corrosion Initiation Reliability Index for Reinforced Concrete Sections Exposed to Severe Maximum Temperature Levels. Am. J. Sci. Eng. Technol. 2026, 11(3), 173-185. doi: 10.11648/j.ajset.20261103.17

    Copy | Download

    AMA Style

    Hassan M. Evaluating Carbonation-Induced Corrosion Initiation Reliability Index for Reinforced Concrete Sections Exposed to Severe Maximum Temperature Levels. Am J Sci Eng Technol. 2026;11(3):173-185. doi: 10.11648/j.ajset.20261103.17

    Copy | Download

  • @article{10.11648/j.ajset.20261103.17,
      author = {Mostafa Hassan},
      title = {Evaluating Carbonation-Induced Corrosion Initiation Reliability Index for Reinforced Concrete Sections Exposed to Severe Maximum Temperature Levels},
      journal = {American Journal of Science, Engineering and Technology},
      volume = {11},
      number = {3},
      pages = {173-185},
      doi = {10.11648/j.ajset.20261103.17},
      url = {https://doi.org/10.11648/j.ajset.20261103.17},
      eprint = {https://article.sciencepublishinggroup.com/pdf/10.11648.j.ajset.20261103.17},
      abstract = {The purpose of this research is to evaluate the carbonation depth and the probability of carbonation-induced corrosion initiation (PCICI) values across various temperature levels for concrete mixes, including various percentages of fly ash (FA). The concrete sections are subjected to a combination of severe peak temperatures and CO2 concentrations. Moreover, the maximum temperature levels varied from 25°C to 45°C, reflecting their effects on the diffusion coefficient. The concrete cover (CV) thicknesses used in the probabilistic corrosion model range from 40 mm to 70 mm. The width of the crack (CW) variability ranges from 0.05 to 0.25 mm for cracked sections to determine their effect on probabilistic corrosion initiation. The concrete mixes include various percentages and types of FA, ranging from 5% to 30%, as supplementary cementitious materials (SCMs). The Monte Carlo simulation method is used in conducting the probabilistic corrosion model due to its accuracy. It was deduced that, for a cracked concrete section with a CV of 70 mm and a CW of 0.1 mm, PCICI is significant at 5% when low-calcium fly ash (LCFA) is utilized in the concrete mix, exposed to various severe temperature levels exceeding 30°C. Finally, the impact of using 30% LCFA as SCM poses a high risk on PCICI for uncracked CV of 45 mm, when subjected to maximum temperatures ranging from 35°C to 45°C.},
     year = {2026}
    }
    

    Copy | Download

  • TY  - JOUR
    T1  - Evaluating Carbonation-Induced Corrosion Initiation Reliability Index for Reinforced Concrete Sections Exposed to Severe Maximum Temperature Levels
    AU  - Mostafa Hassan
    Y1  - 2026/08/20
    PY  - 2026
    N1  - https://doi.org/10.11648/j.ajset.20261103.17
    DO  - 10.11648/j.ajset.20261103.17
    T2  - American Journal of Science, Engineering and Technology
    JF  - American Journal of Science, Engineering and Technology
    JO  - American Journal of Science, Engineering and Technology
    SP  - 173
    EP  - 185
    PB  - Science Publishing Group
    SN  - 2578-8353
    UR  - https://doi.org/10.11648/j.ajset.20261103.17
    AB  - The purpose of this research is to evaluate the carbonation depth and the probability of carbonation-induced corrosion initiation (PCICI) values across various temperature levels for concrete mixes, including various percentages of fly ash (FA). The concrete sections are subjected to a combination of severe peak temperatures and CO2 concentrations. Moreover, the maximum temperature levels varied from 25°C to 45°C, reflecting their effects on the diffusion coefficient. The concrete cover (CV) thicknesses used in the probabilistic corrosion model range from 40 mm to 70 mm. The width of the crack (CW) variability ranges from 0.05 to 0.25 mm for cracked sections to determine their effect on probabilistic corrosion initiation. The concrete mixes include various percentages and types of FA, ranging from 5% to 30%, as supplementary cementitious materials (SCMs). The Monte Carlo simulation method is used in conducting the probabilistic corrosion model due to its accuracy. It was deduced that, for a cracked concrete section with a CV of 70 mm and a CW of 0.1 mm, PCICI is significant at 5% when low-calcium fly ash (LCFA) is utilized in the concrete mix, exposed to various severe temperature levels exceeding 30°C. Finally, the impact of using 30% LCFA as SCM poses a high risk on PCICI for uncracked CV of 45 mm, when subjected to maximum temperatures ranging from 35°C to 45°C.
    VL  - 11
    IS  - 3
    ER  - 

    Copy | Download

Author Information
  • Abstract
  • Keywords
  • Document Sections

    1. 1. Introduction
    2. 2. Research Methodology
    3. 3. Analysis of Results
    4. 4. Conclusions
    Show Full Outline
  • Abbreviations
  • Author Contributions
  • Conflicts of Interest
  • References
  • Cite This Article
  • Author Information