Research Article | | Peer-Reviewed

Synthesis Hazenite from Bittern as a Source of Magnesium and Sodium

Received: 26 June 2025     Accepted: 11 July 2025     Published: 4 August 2025
Views:       Downloads:
Abstract

Struvite is a magnesium ammonium phosphate hexahydrate (MAP) crystal with significant potential in agriculture as a slow-release fertilizer. Struvite and its derivatives, such as Hazenite, Struvite-K, and Struvite-Na, can form through specific chemical reactions. Hazenite, a newly discovered mineral in the struvite group, contains two monovalent cations (Na+ and K+) and can be applied in agriculture and orthopedics. Hazenite has an orthorhombic structure with a dipyramidal crystal system and a formula weight of 276.331 g/mol. It was first discovered in Mono Lake, California, and named in honor of Robert M. Hazen. Hazenite forms biologically by microbes that precipitate this crystal when phosphorus levels in the environment increase. The precipitation of struvite and its derivatives requires magnesium, which can be sourced from alternatives like bittern, a byproduct of salt production. This study successfully synthesized Hazenite from bittern as a source of magnesium and sodium. XRD characterization revealed that Hazenite is the dominant phase in the sample, with a tubular elongated shape detected through FESEM-EDX. Using Response Surface Methodology (RSM) with a Box-Behnken Design (BBD), optimal conditions for Hazenite production were identified: pH 11.0 - 11.5, reaction time 45 - 50 minutes, and Mg:Na:PO4 molar ratios of 1:1:1 - 1.2:1.2:1 or 1.8:1.8:1 - 2:2:1. These conditions yielded the highest Hazenite percentage (>95%).

Published in Science Journal of Chemistry (Volume 13, Issue 4)
DOI 10.11648/j.sjc.20251304.11
Page(s) 84-101
Creative Commons

This is an Open Access article, distributed under the terms of the Creative Commons Attribution 4.0 International License (http://creativecommons.org/licenses/by/4.0/), which permits unrestricted use, distribution and reproduction in any medium or format, provided the original work is properly cited.

Copyright

Copyright © The Author(s), 2025. Published by Science Publishing Group

Keywords

Hazenite, Struvite, Struvite-K, Bittern, Wastewater

1. Introduction
Struvite, a crystalline compound formed from magnesium, ammonium, and phosphate in equimolar concentrations with six molecules of water (MgNH4PO4.6H2O), is commonly known as magnesium ammonium phosphate hexahydrate (MAP) . This mineral holds significant potential in agriculture as a slow-release fertilizer, providing essential nutrients such as magnesium, nitrogen, and phosphorus to plants . The formation of struvite can be represented by the following reaction:
Mg2+ + NH4+ + PO43− + 6H2O → MgNH4PO4.6H2O .
Struvite has several derivative compounds, including Hazenite, Struvite-K, and Struvite-Na. Hazenite, a newly discovered mineral in the struvite group, contains two structurally distinct monovalent cations (Na+ and K+) . It belongs to the M1+M2+Mg2(PO4)2.14H2O group, where M1+ and M2+ can be K+, Na+, or NH4+. The first observation of Hazenite was in Mono Lake, California, which has highly alkaline (pH ≈10) and saline (84-92 g/L) conditions. Hazenite is synthesized by cyanobacteria and is biodegradable . The formation of Hazenite involves several stages, as shown in the following reactions:
Mg2+ + K+ + PO43− + 6H2O → MgKPO4.6H2O + H+ .
2MgKPO4.6H2O+Na++2H2O→KNaMg2(PO4)2.14H2O+K+ .
Struvite-K, which contains potassium (a limited nutrient in soil) instead of ammonium (abundant in the environment), can replace NH4+ (1.48 Å) with potassium (1.33 Å) during crystallization due to their similar ionic radii . The concentrations of Mg, K, and P in Struvite-K are equimolar, similar to Struvite (MAP), and its formation is represented by the following reaction:
Mg2+ + K+ + PO43− + 6H2O → MgKPO4.6H2O + H+ .
Struvite-Na, another derivative of Struvite, contains excess water molecules . In Struvite-Na, Na(H2O)+ replaces NH4+. Generally, the stability of struvite derivatives (MgXPO4.nH2O) is closely related to the ionic radius of the variable ion X; the larger the ionic radius, the greater the stability of the compound. Therefore, Struvite-Na has much lower stability than Struvite and Struvite-K . The formation of Struvite-Na is represented by the following reaction:
Mg2+ + Na+ + PO43− + 7H2O → MgNaPO4.7H2O + H+ .
Hazenite, a newly discovered mineral in the struvite group, has garnered attention for its applications in agriculture and orthopedics. Its unique structure, containing magnesium, potassium, and sodium, makes it a potential slow-release fertilizer and a protective and reparative bone coating in orthopedics . Recent agricultural studies have shown that Hazenite releases phosphorus more slowly than conventional commercial fertilizers but faster than Struvite .
The precipitation of struvite and its derivatives requires a significant amount of magnesium. Although magnesium is present in wastewater streams, additional magnesium must be added to achieve the necessary molar ratio for struvite and its derivatives to precipitate . The use of insoluble magnesium sources such as Mg(OH)2, MgCO3, and MgO requires pre-dissolution processes to accelerate magnesium dissolution, impacting processing costs and material purity . MgCl2 and MgSO4 have shown excellent performance with removal efficiencies exceeding 90% . However, the use of high-quality magnesium sources contributes up to 75% of production costs, making large-scale applications economically unfeasible . Alternative magnesium sources are needed to reduce production costs without compromising material quality. One such alternative is bittern, a byproduct of salt production, which contains high levels of magnesium ions . Using bittern as an alternative magnesium source can recover 64-68% of N and 89-91% of P from fertilizer wastewater . Bradford-Hartke et al. (2021) synthesized struvite using bittern as an alternative magnesium source compared to conventional MgCl2.6H2O, based on phosphorus removal efficiency and particle size. The experiments showed that phosphorus removal efficiencies from bittern and MgCl2.6H2O were 29% and 37%, respectively, with no significant difference in average particle size. However, these studies only utilized bittern as a magnesium source, overlooking the significant sodium content (±17-20 g/L) in bittern .
Despite the high concentrations of magnesium and sodium in bittern, its simultaneous use as a magnesium and sodium source in Hazenite synthesis has not been reported. Most studies have focused on using bittern as a magnesium source in Struvite and Struvite-K synthesis , while the potential use of sodium from bittern remains underexplored. Utilizing both ions simultaneously could enhance bittern's efficiency and economic value. The formation of Struvite and its derivatives is influenced by several parameters, including solution pH, reactant molar ratio, foreign ions, temperature, reaction time, and magnesium source. Solution pH can affect product quality and purity; increasing solution pH can enhance supersaturation, accelerating crystal growth, but may reduce particle size distribution . The Mg:P molar ratio affects the type of crystals formed. At Mg:P molar ratios < 0.5, newberyite is the dominant crystal. At Mg:P molar ratios of 0.5-0.7, Mg2KH(PO4)2.15H2O and cattite Mg(PO4)2.22H2O crystals form. At Mg:P molar ratios ≥ 1, Struvite-K is the dominant crystal .
The presence of foreign ions in the precipitation solution can reduce product purity . Ca2+ ions can interfere with crystallization by competing with Mg2+ ions for binding with phosphate ions, reducing phosphate ion availability in the solution . Reaction time can affect crystal size, quantity, and purity. Longer precipitation times allow more crystals to form as ions in the solution have more time to reach saturation and form new nuclei. Rahman et al. (2014) reported that the average crystal size of struvite was 42 µm and 58 µm at solution pH 9, Mg:PO4 molar ratios of 1:1 and 1:1.2, and a reaction time of 30 minutes. However, when the reaction time increased to 1 hour, the crystal size changed to 67 µm and 80 µm under the same operational conditions. Optimizing the parameters mentioned above is crucial for producing materials with optimal characteristics. Response Surface Methodology (RSM) is an effective statistical approach for testing multiple parameters with a minimal number of experimental trials . This method involves mathematical and statistical procedures to design experiments that analyze parameter effects on response variables to determine the optimal experimental point. RSM commonly uses two designs to determine the optimal point.
2. Experimental
2.1. Materials
Bittern was collected from a traditional salt-making household scale industry in the Wini area of North Insana District, North Central Timor Regency, East Nusa Tenggara Province as a source of Magnesium and Sodium. Aquades, Magnesium Chloride Hexahydrate (MgCl2.6H2O), Potassium Dihydrogen Phosphate (KH2PO4), Sodium Sulfate (Na2SO4), Sodium Hydroxide (NaOH) were purchased from Sigma-Aldrich, Germany.
2.2. Instrumentation
The equipment used in this study were glassware such as beakers, measuring cups, Erlenmeyers, measuring flasks, measuring pipettes, droppers, watch glasses, glass funnels, and other supporting equipment such as suction balls, magnetic stirrers, universal pH indicators, pH meters, spatulas, analytical balances, sample bottles and plastic wrap. The instruments used in this study were Atomic Absorption Spectroscopy (AAS Thermo Scientific ICE 3000 Series), X-ray Diffraction (XRD PANalytical type Xpert Pro), Fourier Transform Infra-Red spectrophotometer (FT-IR Shimadzu Instrument Spectrum One 8400S) and Field Emission Scanning Electron Microscopy Energy Dispersive X-Ray (FESEM-EDX).
2.3. Procedures
2.3.1. Introduction Analysis
Bittern samples were filtered using whatman no.42 filter paper to separate impurities in the sample. Then 45 mL of the sample was put in a vial bottle for analysis of magnesium, sodium, potassium and calcium metal ion levels using Atomic Absorption Spectroscopy (AAS) at the Chemistry Department Laboratory, State University of Malang.
2.3.2. Synthesis Hazenite
Hazenite was synthesized using a beaker with stable stirring using a magnetic stirrer. Bittern was dissolved using distilled water as appropriate. The dilution results were collected as much as 250 mL and put into a beaker and then MgCl2.6H2O and KH2PO4 were added to the beaker so that the molar ratio of the reactants Mg: Na: PO4 became 1: 1: 1. The solution was stirred using a magnetic stirrer at 200 rpm for 30 minutes. Then 1 M NaOH was added to adjust the initial pH of the solution. In this study, the initial pH of the solution used was 10, 11 and 12. To determine the effect of reactant molar ratio, solution pH and reaction time, an experimental design with 15 experiments was conducted. The variation of molar ratio of reactants Mg:Na:PO4 used ranged from 1:1:1 - 2:2:1 and the reaction time used was 15, 45 and 75 minutes. The set of experimental design is presented in Table 1. After completion of stirring, the solution was allowed to stand and then filtered to separate the filtrate and residue. The residue obtained was dried at room temperature. The residues were crushed until soft and then stored in paper clips for further analysis.
Table 1. The set of experimental design.

StdOrder

Run Order

PtType

Blocks

Molar Ratio Mg:Na:PO4

pH

Reaction time (minute)

1

1

2

1

1

10

45

2

2

2

1

2

10

45

3

3

2

1

1

12

45

4

4

2

1

2

12

45

5

5

2

1

1

11

15

6

6

2

1

2

11

15

7

7

2

1

1

11

75

8

8

2

1

2

11

75

9

9

2

1

1,5

10

15

10

10

2

1

1,5

12

15

11

11

2

1

1,5

10

75

12

12

2

1

1,5

12

75

13

13

0

1

1,5

11

45

14

14

0

1

1,5

11

45

15

15

0

1

1,5

11

45

1

1

2

1

1

10

45

2

2

2

1

2

10

45

3

3

2

1

1

12

45

4

4

2

1

2

12

45

5

5

2

1

1

11

15

6

6

2

1

2

11

15

7

7

2

1

1

11

75

8

8

2

1

2

11

75

9

9

2

1

1,5

10

15

10

10

2

1

1,5

12

15

11

11

2

1

1,5

10

75

12

12

2

1

1,5

12

75

13

13

0

1

1,5

11

45

4

14

0

1

1,5

11

45

15

15

0

1

1,5

11

45

*Note: The molar ratio of Magnesium is directly comparable to that of Sodium
2.3.3. Characterization of Hazenite
The samples were characterized using X-ray diffraction with a powder diffractometer (PHILIPS-binary X'Pert MPD, 30 mA, 40 kV) and Cu-Ka radiation in the range 2θ = 5°- 100°. Fourier Transform Infra-Red (FTIR) using a Shimadzu Instrument Spectrum One 8400S FTIR in the wave number range of 4000-400 cm-1.
3. Results and Discussion
3.1. Bittern Analysis
Preliminary tests on bittern showed that bittern has a high enough magnesium and sodium content so that it can be used as a source of magnesium and sodium in Struvite-Na Synthesis. Based on the results of AAS characterization, the bittern used is diluted up to several thousand times, this is because to adjust the optimal concentration range for accurate measurement. The actual concentration of the AAS results was calculated using the equation:
Actual concentration=Measured Concentration×Dilution Factor.
Therefore, the AAS results obtained based on the formula above are Magnesium levels of 249,000 mg/L, Sodium of 13,987 mg/L, Potassium of 81,090 mg/L and Chlorine of 131.82 mg/L. These AAS results are almost the same as some previous researchers such as those conducted by .
Table 2. Bittern Characterization Using AAS Spectrophotometer.

Components

Unit

Value

Ca

mg/L

131,82

K

mg/L

81.090

Mg

mg/L

249.000

Na

mg/L

13.987

3.2. Effect of Solution pH on the Molar Ratio of Reactans Mg:Na:PO4 1:1:1 with 30 Minute Reaction Time
XRD characterization has been carried out on the precipitation samples. The XRD results of the synthesis with variations in solution pH from 10 to 12 at a molar ratio of Mg:Na:PO4 of 1:1:1 are shown in the Figure 1.
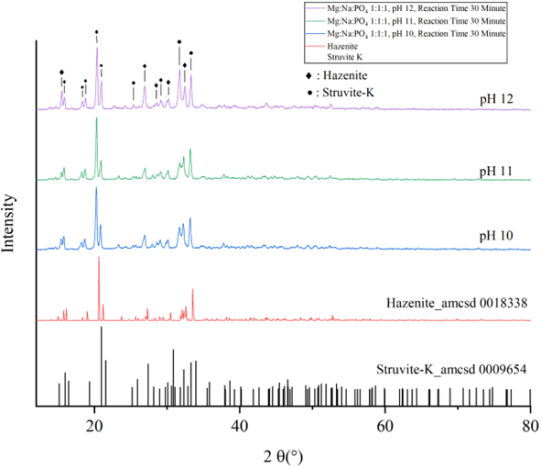
Figure 1. Effect of solution pH on Hazenite precipitation at a molar ratio of Mg:Na:PO4 of 1:1:1 with a reaction time of 30 minutes.
The XRD results from the effect of pH on the molar ratio of reactants Mg:Na:PO4 1:1:1 with a reaction time of 30 minutes confirmed that the solid produced was hazenite. However, the hazenite produced from bittern was not pure due to the complex composition of the bittern, which led to the formation of other minerals such as Struvite-K. Therefore, phase identification was carried out using Rietica based on the Rietveld refinement method, focusing on four parameters: pattern factor (Rp), weighted pattern factor (Rwp), expected error (Rexp), and goodness of fit (GOF), which are commonly used to evaluate the quality of refinement work.
Based on phase identification results, Hazenite (a derivative compound of struvite) precipitated from the solution offers further opportunities to use the Rietveld method to measure phase abundance in the product. Figure 2 presents the XRD patterns of samples analyzed with Rietveld refinement (at a molar ratio of Mg:Na:PO4 1:1:1 with a reaction time of 30 minutes at pH ranges of a) 10, b) 11, and c) 12). The results show the agreement and differences between the observed and calculated diffraction patterns. Four index parameters: Rp, Rwp, Rexp, and GOF, which indicate the quality of the refinement work in this study, are presented in Table 3. The ideal value for GOF is ≤ 4.0. The observed refinement work has acceptable quality, except for the pH 12 solution variation, which shows a GOF value > 4. This may be due to the presence of other phases precipitating alongside Hazenite and Struvite-k that were not observed in this study.
The study conducted by on the thermodynamic modeling of the solubility product of struvite-K found that within the pH range of 11.5 - 12, cattite can co-precipitate with struvite-K in the resulting precipitate. Notably, at pH 12, the quantity of cattite increases. The XRD results show peaks similar to those reported by . Phase composition analysis using Rietica Software indicates that hazenite is the dominant phase in the solid, with a small amount of Struvite-K present (Table 2).
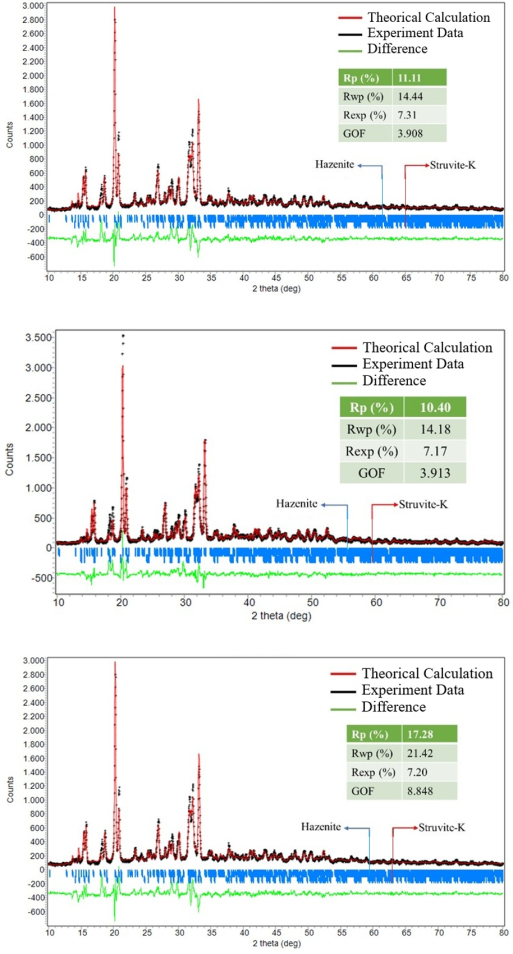
Figure 2. Presents example XRD patterns (from samples precipitated at pH a) 10, b) 11, and c) 12) with a molar ratio of Mg/Na/PO4 1:1:1) analyzed using Rietveld refinement, showing the agreement and differences between the observed and calculated diffraction patterns.
Table 3. Phase Composition Analysis Results using Rietica Software from X-ray diffraction data for the effect of solution pH on Hazenite precipitation at a reactant molar ratio of 1:1:1 with a reaction time of 30 minutes.

Sample

Phase (%)

GOF

Rp (%)

Rwp (%)

Rexp (%)

Hazenite

Struvite-K

X2

82,49

17,51

3,908

11,11

14,44

7,31

Y2

91,52

8,48

3,913

10,40

14,18

7,17

Z2

87,59

12,41

8,848

17,28

21,42

7,20

The Hazenite content formed at pH 10, 11, and 12 is 82.49%, 91.52%, and 87.59%, respectively, while the Struvite-K content formed at the same pH ranges is 17.51%, 8.48%, and 12.41%, respectively. pH 11 is the optimum pH for Hazenite formation under the influence of pH on the reactant molar ratio of 1:1:1 with a reaction time of 30 minutes.
Fourier Transform Infrared Spectroscopy (FTIR) was used to analyze potential changes in the internal structure of the resulting crystals. FT-IR spectroscopy is highly sensitive for detecting water in crystals and its bonding state within the crystal structure. The FT-IR spectrum of the resulting precipitate is presented in Figure 3. The FT-IR spectrum shows a broad H-O-H stretching vibration around the wavenumber 2978 cm-1, and an H-O-H bending vibration observed around the wavenumber 1637 cm-1 . The v1 PO4 vibration band is observed around the wavelength 1022 cm-1, referring to asymmetric deformation, and the v4 vibration around the wavenumber 572 cm-1, referring to symmetric deformation .
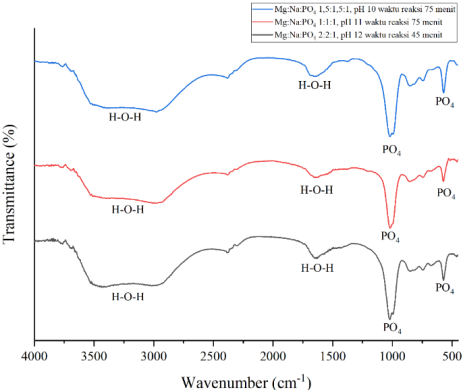
Figure 3. FTIR Results of the Precipitate.
To study the surface morphology, the synthesized samples were characterized using FESEM. The FESEM-EDX characterization results are shown in Figures 4, 5, and 6. Figure 4a shows the particle distribution of the analyzed sample. Generally, the FESEM image shows elongated tubular-shaped particles (Figure 4c), with their surfaces covered by small particles. This is due to the bittern used as a source of magnesium and sodium containing calcium ions . Figure 4c also shows cracks and fractures on the particle surfaces, which can be attributed to the substitution of K+ ions into the crystal lattice .
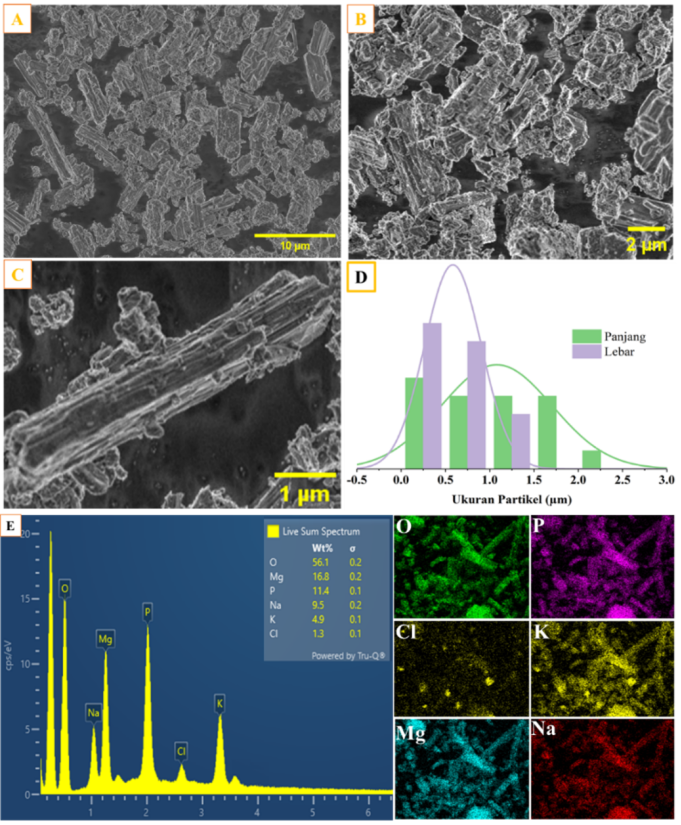
Figure 4. FESEM-EDX results of the synthesized sample with a reactant molar ratio of Mg:Na:PO4 1:1:1 at pH 10 and a reaction time of 30 minutes. a) Size 10 µm, b) Size 2 µm, c) Hazenite shape at 1 µm, d) Particle length and width, e) EDX and Mapping results.
Based on Figure 4d, the average particle length is 1.055 µm and the average particle width is 0.583 µm. The EDX results from Figure 5e show the presence of elements that form Hazenite, such as Mg, P, Na, O, and K. There is also a small amount of Cl, which is present because the sample used is a waste product from salt production, leading to the accumulation of chloride ions in the waste sample used.
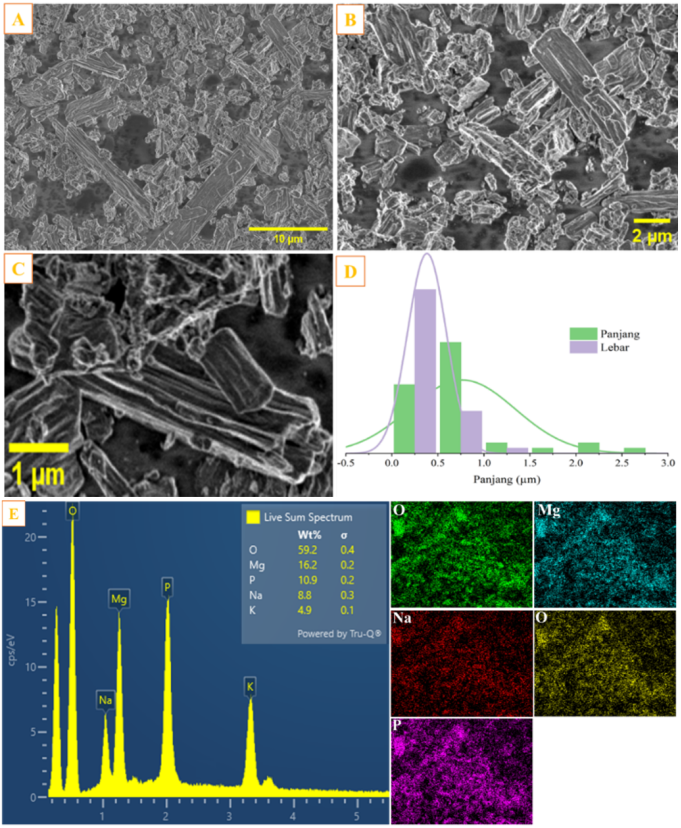
Figure 5. FESEM-EDX results of the synthesized sample with a reactant molar ratio of Mg:Na:PO4 1:1:1 at pH 11 and a reaction time of 30 minutes. a) Size 10 µm, b) Size 2 µm, c) Hazenite shape at 1 µm, d) Particle length and width, e) EDX and Mapping results.
Figure 5a shows the particle distribution of the analyzed sample. The particle shape can be seen in Figure 5c, which shows elongated tubular particles with fine particles adhering to the main particles . These fine particles can be attributed to the presence of calcium ions in the bittern sample used. Figure 5d shows the length and width of the particles, with an average particle length of 0.76445 µm and an average particle width of 0.3809 µm. Figure 6e presents the EDX results, indicating the presence of the main elements forming Hazenite in the sample.
Figure 6 shows the FESEM-EDX results of the sample synthesized with a pH variation of 12. Figure 6a shows the particle distribution, indicating that the particles appear irregular but generally resemble elongated tubular shapes , as clearly seen in Figure 6c. The particle surfaces also show agglomerates, which are associated with the presence of calcium ions in the bittern sample. The presence of calcium ions can alter the particle shape of Hazenite. Figure 6d shows the length and width of the particles, with an average particle length of 0.5197 µm and an average particle width of 0.2491 µm.
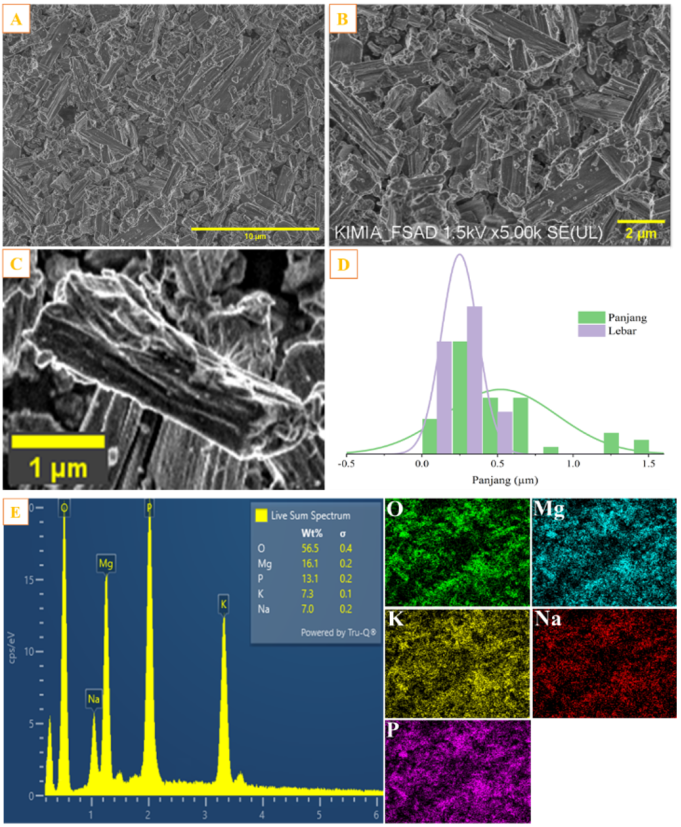
Figure 6. FESEM-EDX results of the synthesized sample with a reactant molar ratio of Mg:Na:PO4 1:1:1 at pH 12 and a reaction time of 30 minutes. a) Size 10 µm, b) Size 2 µm, c) Hazenite shape at 1 µm, d) Particle length and width, e) EDX and Mapping results.
Figure 6e shows the EDX and mapping results of the sample synthesized at pH 12. The image reveals the presence of the main elements forming Hazenite, namely Mg, Na, K, P, and O.
Based on the particle length and width measurements obtained from FESEM analysis, it can be observed that increasing the solution pH at the same molar ratio and reaction time affects the particle size. As the solution pH increases from 10 to 12, the average particle length and width decrease. This result indicates that fine particles increase with increasing supersaturation through the rise in solution pH. It suggests that a reaction time of 30 minutes is insufficient for complete crystal growth at this supersaturation, leading to an increase in fine particles in the sample . Supersaturation is the main driving force for the crystallization process and significantly influences particle size and distribution due to its strong effect on the nucleation rate.
3.3. The Effect of Variations in Reactant Molar Ratio, Solution pH, and Reaction Time Using Experimental Design (Response Surface Methodology)
To determine the effect of variations in reactant molar ratio, solution pH, and reaction time, a series of experiments were conducted using experimental design (Response Surface Methodology) based on the Box-Behnken design to obtain the phase percentage from the XRD characterization of the resulting samples. A total of 15 experiments were conducted with 3 repetitions at the central point. The synthesized samples were characterized using XRD. The X-ray diffraction patterns are shown in Figure 7. The synthesis results with variations in molar ratio, solution pH, and reaction time indicate that Hazenite is the main peak in the synthesized material, as reported by . However, the Hazenite produced is not pure because the bittern waste used contains a complex mixture of compounds, leading to the formation of other minerals. Therefore, phase identification was performed using Rietica based on the Rietveld refinement method, with four parameters considered: pattern factor (Rp), weighted pattern factor (Rwp), expected error (Rexp), and goodness of fit (GOF), which are commonly used to evaluate the quality of the refinement work.
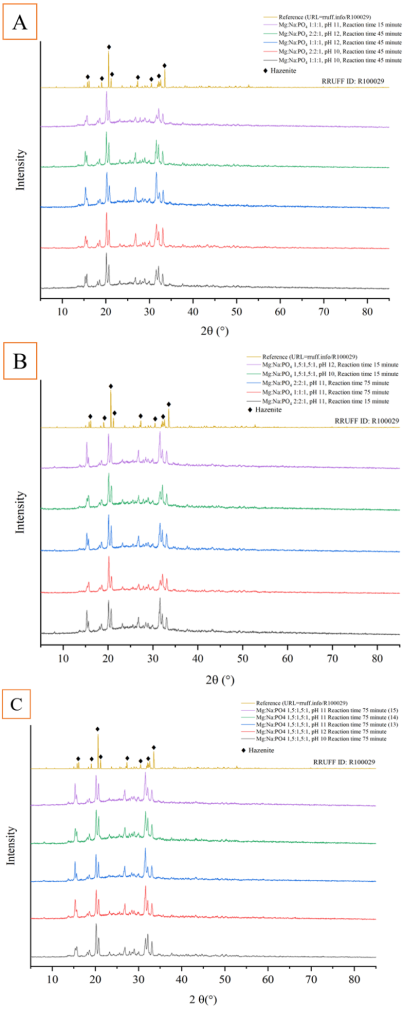
Figure 7. The Effect of Variations in Reactant Molar Ratio, Solution pH, and Reaction Time: A (Experiments 1-5), B (Experiments 6-10), and C (Experiments 11-15).
Table 4. Phase Composition Results Based on XRD (Response Surface Methodology) Processed Using Rietica Software.

No Sampel

Phase (%)

X2

R-Factor

Hazenite

Struvite-K

1

91,25

8,75

4,557

5,09

2

75,12

24,88

8,057

10,28

3

78,26

21,74

8,304

16,4

4

97,11

2,89

8,025

13,84

5

95,75

4,25

6,824

13,07

6

96,11

3,89

7,968

15,32

7

99,47

0,53

6,26

12,41

8

95,87

4,13

7,497

13,55

9

70

13,73

6,878

9,78

10

92,09

7,91

8,849

17,35

11

99,52

0,48

8,473

14,46

12

72,26

27,74

9,203

-

13

94,46

5,54

9,953

18,38

14

95,11

4,89

7,305

14,42

15

97,7

2,3

8,047

13,62

Table 4. shows the phase analysis results using Rietica Software, indicating that Hazenite is the main phase in the synthesized solid, with a small amount of Struvite-K present.
3.3.1. Box-Behnken Design Modeling
The synthesis results from the precipitation process can vary depending on the operating conditions, such as solution pH, reactant molar ratio, and reaction time. These operating conditions can affect the quality of the produced product, including the phases formed, particle size, and particle shape. In this study, Minitab 19 software was used to analyze the experimental design results to determine the effect of the operating conditions. A Box-Behnken design with 3 factors and 3 levels was used to evaluate the correlation between the combined effects of each operating condition and a single response. The response used in this study was the percentage of the Hazenite phase, obtained from XRD characterization and Rietveld refinement using the Rietica application.
The total number of experiments conducted based on the BBD was 15, including 12 experiments and 3 repetitions at the central point. The experimental and predicted values for the percentage of the Hazenite phase are summarized in Table 4. The experimental values show that the percentage of the Hazenite phase varies in the range of 70 to 99.52%. The plot of predicted and experimental values is shown in Figure 8. Based on this figure, it can be concluded that the predicted values are close to the experimental values, indicating that the Box-Behnken design method is suitable for the response of the Hazenite phase percentage.
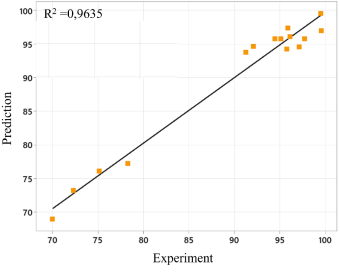
Figure 8. Plot of Predicted vs. Experimental Values.
Table 5. Box-Behnken Design with 3 Factors, Including Experimental and Predicted Response Values.

Run No

Factor codes and actual values

Response% Hazenite Phase)

Ratio Molar Mg:Na:PO4

pH

Reaction time

Predicted (%)

Experimental (%)

1

1

10

45

93,766

91,25

2

2

10

45

76,146

75,12

3

1

12

45

77,234

78,26

4

2

12

45

94,594

97,11

5

1

11

15

94,229

95,75

6

2

11

15

96,079

96,11

7

1

11

75

99,501

99,47

8

2

11

75

97,391

95,87

9

1,5

10

15

69,005

70,00

10

1,5

12

15

94,638

92,09

11

1,5

10

75

96,973

99,52

12

1,5

12

75

73,255

72,26

13

1,5

11

45

95,757

94,46

14

1,5

11

45

95,757

95,11

15

1,5

11

45

95,757

97,70

3.3.2. Statistical Analysis
Linear, interactive, quadratic, and cubic models were applied to the experimental data to obtain the appropriate model. Sequential model sum of squares tests and model summary statistics tests were conducted on the different models, and the results are shown in Table 5. Equation (1) is the polynomial equation obtained, which shows the empirical relationship between the factors used and the response of the Hazenite phase percentage.
% Hazenite phase = -1250 - 207,6*A + 252,9*B + 4,724*C + 6,02*A*A - 11,83*B*B- 0,00051*C*C + 17,49 *A*B - 0,0660*A*C - 0,4113*B*C.(1)
where A is the reactant molar ratio of Mg:Na:PO4, B is the solution pH, and C is the reaction time.
Table 6. ANOVA Results for the Percentage of Hazenite Phase.

Source

DF

Adj SS

Adj MS

F-Value

P-Value

Model

9

1480,65

164,517

20,44

0,002

Linear

3

23,55

7,850

0,98

0,474

M Mg:Na:PO4

1

0,03

0,034

0,00

0,951

pH

1

1,83

1,834

0,23

0,653

time

1

21,68

21,681

2,69

0,162

Square

3

538,43

179,476

22,30

0,003

M Mg:Na:PO4*

1

8,37

8,368

1,04

0,355

pH larutan*

1

516,48

516,480

64,18

0,000

time*

1

0,79

0,788

0,10

0,767

2-Way Interaction

3

918,68

306,225

38,05

0,001

M Mg:Na:PO4*pH

1

305,90

305,900

38,01

0,002

Mg:Na:PO4*time

1

3,92

3,920

0,49

0,516

pH*time

1

608,86

608,856

75,66

0,000

Error

5

40,24

8,047

Lack-of-Fit

3

34,36

11,453

3,90

0,211

Pure Error

2

5,88

2,938

R2

0,9735

When analyzing the ANOVA results, a large F-value with a small p-value (i.e., p < 0.05) indicates that the model is statistically significant . From the ANOVA results reported in Table 6, the p-value was found to be < 0.05 for the Hazenite phase percentage data, with an F-value > 20.44, indicating a significant model fit. The F-test provides a low probability value, indicating high model significance for the response used. However, when the linear model is used, the hypothesis is not recommended because the p-value is > 0.05. The recommended hypothesis is for the quadratic model and the interaction between two factors, each having a p-value < 0.05. Additionally, the high coefficient of determination (R²) of 0.9735 indicates a good correlation between the measured and predicted responses for the Hazenite phase percentage.
In this study, the quadratic parameter (B²) significantly influences the Hazenite phase percentage response. The two-factor interaction in Table 5 shows that the interaction between the reactant molar ratio and solution pH, and the interaction between solution pH and reaction time, significantly affect the Hazenite phase percentage response, with p-values of 0.002 and 0.000, respectively. Therefore, p-values > 0.1 are considered not statistically significant .
3.3.3. Effect of Variables Through Response Surface
The interaction effects of the parameters used were evaluated with 3D response surface plots when the values of other parameters were set at certain values. The 3D response surface and contour plots for the output percentage of Hazenite phase provide a graphical representation of the quadratic equation and clearly show the relationship between experimental parameters and response. Figure 9 shows the 3D response surface and contour plots of the experimental results. Figure 9a shows a combined surface plot and contour plot in the Hazenite formation process, providing a comprehensive picture of the effect of the Mg:Na:PO4 molar ratio and solution pH on the percentage of Hazenite produced, with the reaction time kept constant at 45 minutes. The surface plot displays a three-dimensional visualization showing the non-linear relationship between these variables, while the contour plot provides a two-dimensional view that facilitates the interpretation of the optimal area.
Based on these two plots, the highest percentage of Hazenite (>96%) can be achieved under two optimal operating conditions. The first condition is at a pH combination of 11-11.5 with a molar ratio of 1.4:1.4:1 - 1.6:1.6:1, and the second condition is at a pH above 11.5 with a molar ratio of around 1:1:1 - 1.2:1.2:1. This is clearly seen from the dark green area on the contour plot and the peak surface on the surface plot. The black dot seen on the contour plot around pH 11 and a molar ratio of 1.4:1.4:1 indicates a stationary point that may be a local optimal point. Both plots also show areas to avoid, namely at low pH conditions (10 - 10.5) combined with high molar ratios (1.8:1.8:1 - 2:2:1) or low molar ratios (1:1:1), where the percentage of Hazenite produced is less than 80%. The curved surface shape on the surface plot and the varying contour line patterns on the contour plot indicate a complex interaction between pH and molar ratio in the formation of Hazenite.
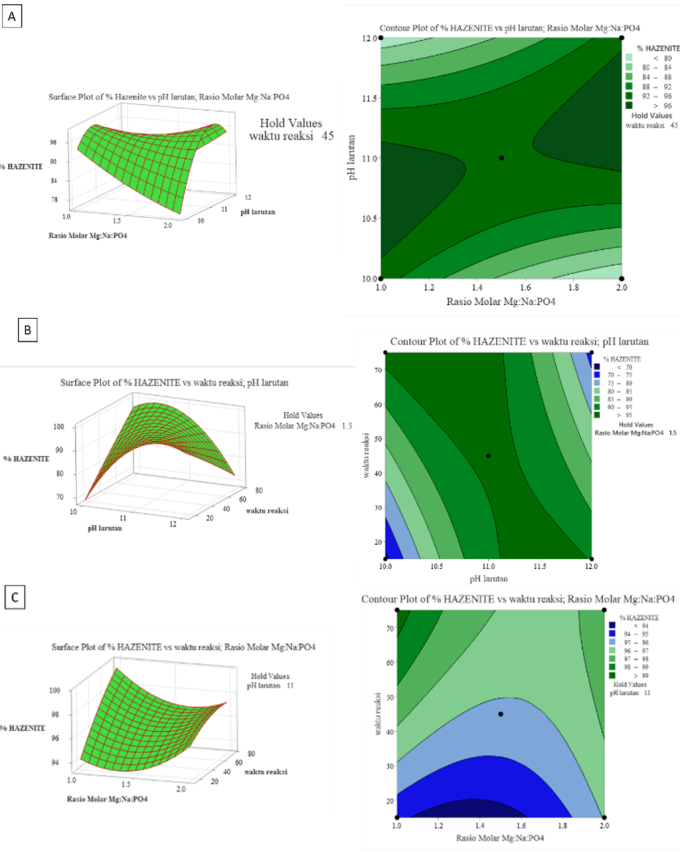
Figure 9. Three-dimensional response surface plot for interactive effect on hazenite phase percentage response, A) hold value at reaction time 45 minute, B) hold value at ratio molar Mg:Na:PO4 1,5:1,5:1 and C). Hold value at pH 11.
Figure 9b shows the relationship between reaction time and solution pH on the percentage of Hazenite phase produced, with the Mg:Na:PO4 molar ratio kept constant at 1.5:1.5:1. The surface plot displays a three-dimensional visualization that shows a mountain-shaped curve, indicating an optimal point in the Hazenite formation process. From these plots, it can be observed that the highest percentage of Hazenite phase (>95%) is achieved at a solution pH of around 11 - 11.5 with a reaction time between 40-50 minutes. This is clearly seen from the peak area on the surface plot and the dark green region on the contour plot. The black dot seen on the contour plot around pH 11 and a reaction time of 45 minutes indicates a stationary point that is likely the optimal process condition. An interesting trend is observed in the effect of reaction time and pH on Hazenite formation. At low pH (10 - 10.5) with a short reaction time (15-25 minutes), the percentage of Hazenite phase produced is very low (<70%), as indicated by the blue area on the contour plot. As pH and reaction time increase, the percentage of Hazenite phase increases significantly until it reaches an optimal point, but then decreases again at excessively long reaction times (>60 minutes) or excessively high pH (>11.5). Based on this analysis, to optimize Hazenite phase production with an Mg:Na:PO4 molar ratio of 1.5:1.5:1, it is recommended to operate the process at a pH of around 11 - 11.5 with a reaction time of 40 - 50 minutes. This condition is expected to yield the highest percentage of Hazenite phase (>95%). It is important to avoid the combination of low pH and short reaction time as it will result in a very low percentage of Hazenite phase. Understanding these patterns and interactions is crucial for controlling the process and maintaining consistent product quality.
Figure 9c shows the relationship between reaction time and the Mg:Na:PO4 molar ratio on the percentage of Hazenite phase produced, with the solution pH kept constant at 11. The surface plot shows a three-dimensional surface that tends to form a valley with Hazenite percentage variations from 94% to over 99%. Based on these plots, the highest percentage of Hazenite phase (>99%) can be achieved under two different conditions. The first condition is at a longer reaction time (60-70 minutes) with a molar ratio of around 1:1:1 - 1.2:1.2:1, and the second condition is at a similar reaction time with a higher molar ratio (1.8:1.8:1 - 2:2:1). This is seen from the dark green area on the contour plot and the rising edges on the surface plot. The black dot on the contour plot around a molar ratio of 1.4:1.4:1 and a reaction time of 45 minutes indicates a stationary point that yields a relatively lower percentage of Hazenite (94-95%). An interesting pattern is observed in the distribution of Hazenite phase percentage, where there is a "valley" area in the middle of the plot (molar ratio 1.2:1.2:1 - 1.6:1.6:1 and reaction time 30-50 minutes) that yields a lower percentage of Hazenite phase (94-96%). As the molar ratio changes towards the extremes (either to 1:1:1 or 2:2:1) and the reaction time becomes longer, the percentage of Hazenite phase increases significantly until it reaches a maximum value. To optimize Hazenite phase production at pH 11, it is recommended to operate the process under one of the two identified optimal conditions, namely a reaction time of 60-70 minutes with a molar ratio of 1:1:1 - 1.2:1.2:1 or 1.8:1.8:1 - 2:2:1. It is important to avoid the middle area of the plot that yields a lower percentage of Hazenite phase. Understanding these patterns and interactions is crucial for controlling the process and ensuring consistently optimal Hazenite production.
4. Conclusion
In this study, Hazenite was successfully synthesized from bittern as a source of magnesium and sodium, as evidenced by XRD characterization. The XRD results indicated the presence of two phases: Hazenite and Struvite-K. Rietica analysis confirmed that Hazenite was the dominant phase in the sample. FTIR analysis revealed the presence of H-O-H stretching and bending vibrations at wavenumbers 2978 and 1637 cm-1, and PO4 vibrations at 1022 and 572 cm-1. FESEM-EDX analysis showed that Hazenite has an elongated tubular shape, with particle agglomeration on the surface. EDX analysis identified the elements constituting Hazenite, including Mg, Na, K, P, and O. To determine the effects of varying reactant molar ratios, solution pH, and reaction time, experiments were designed using Response Surface Methodology (RSM) based on the Box-Behnken Design (BBD). The parameters used were reactant molar ratios, solution pH, and reaction time, with a total of 15 experiments conducted. The percentage of Hazenite phase was measured as the response variable. Comprehensive RSM analysis involving three main variables solution pH, reaction time, and Mg:Na:PO4 molar ratio—identified the optimal operating conditions for Hazenite production. The results showed that the highest percentage of Hazenite (>95%) could be achieved at a pH range of 11.0 - 11.5, with a reaction time of 45 - 50 minutes, and Mg:Na:PO4 molar ratios in the ranges of 1:1:1 - 1.2:1.2:1 or 1.8:1.8:1 - 2:2:1.
Abbreviations

MAP

Magnesium Ammonium Phosphate Hexahydrate

XRD

X-ray Diffraction

FESEM

Field Emission Scanning Electron Microscopy

EDX

Energy Dispersive X-ray Spectroscopy

RSM

Response Surface Methodology

BBD

Box-Behnken Design

AAS

Atomic Absorption Spectroscopy

FT-IR

Fourier Transform Infra-Red Spectrophotometer

Rp

Pattern Factor

Rwp

Weighted Pattern Factor

Rexp

Expected Error

GOF

Goodness of Fit

Acknowledgments
The authors gratefully acknowledge financial support from the Institut Teknologi Sepuluh Nopember for this work, under project scheme of the Publication Writing and IPR Incentive Program (PPHKI) 2025.
Author Contributions
Afifah Rosyidah: Conceptualization, Data curation, Funding acquisition, Investigation, Methodology, Project administration, Resources, Supervision, Writing – review & editing
Flavianus Meko: Formal Analysis, Writing – original draft
Conflicts of Interest
The authors declare no conflicts of interest.
References
[1] S. Kumari, S. Jose, M. Tyagi, and S. Jagadevan, “A holistic and sustainable approach for recovery of phosphorus via struvite crystallization from synthetic distillery wastewater,” J. Clean. Prod., vol. 254, p. 120037, May 2020,
[2] S. Kataki, H. West, M. Clarke, and D. C. Baruah, “Phosphorus recovery as struvite: Recent concerns for use of seed, alternative Mg source, nitrogen conservation and fertilizer potential,” Resour. Conserv. Recycl., vol. 107, pp. 142-156, 2016.
[3] B. Tansel, G. Lunn, and O. Monje, “Struvite formation and decomposition characteristics for ammonia and phosphorus recovery: A review of magnesium-ammonia-phosphate interactions,” Chemosphere, vol. 194, pp. 504-514, Mar. 2018,
[4] S. Lapinkangas, L. Rautio, T. Kauppinen, T. Hu, J. Pesonen, and U. Lassi, “Precipitation of potassium as hazenite from washing water of spent alkaline batteries,” Chem. Eng. J. Adv., vol. 12, p. 100426, Nov. 2022,
[5] B. Xu, C. C. D. Coumes, D. Lambertin, and B. Lothenbach, “Compressive strength and hydrate assemblages of wollastonite-blended magnesium potassium phosphate cements exposed to different pH conditions,” Cem. Concr. Compos., vol. 143, p. 105255, Oct. 2023,
[6] A. Yesigat et al., “Phosphorus recovery as K-struvite from a waste stream: A review of influencing factors, advantages, disadvantages and challenges,” Environ. Res., vol. 214, p. 114086, 2022.
[7] C. K. Chauhan and M. J. Joshi, “Growth and characterization of struvite-Na crystals,” J. Cryst. Growth, vol. 401, pp. 221-226, Sep. 2014,
[8] H. Huang et al., “Alleviating Na+ effect on phosphate and potassium recovery from synthetic urine by K-struvite crystallization using different magnesium sources,” Sci. Total Environ., vol. 655, pp. 211-219, Mar. 2019,
[9] Y. Zhang, Y. J. Guo, J. Y. Dai, L. Zhao, and L. P. Wu, “Fabrication of hazenite conversion coating on AZ31 Mg alloy,” Surf. Coat. Technol., vol. 435, p. 128249, Apr. 2022,
[10] Q. Guan et al., “A review of struvite crystallization for nutrient source recovery from wastewater,” J. Environ. Manage., vol. 344, p. 118383, 2023.
[11] D. M. Rodrigues, R. do Amaral Fragoso, A. P. Carvalho, T. Hein, and A. G. de Brito, “Are alternative magnesium sources the key for a viable downstream transfer of struvite precipitation? Assessment of process feasibility and precipitate characteristics,” J. Water Process Eng., vol. 45, p. 102508, 2022.
[12] M.-V. Le, T. H. T. Duy, B.-T. Dang, and N. Q. Long, “Phosphorus recovery from fertilizer industrial wastewaters using bittern: Influence of wastewater composition and pH on struvite formation,” Bioresour. Technol. Rep., vol. 25, p. 101752, 2024.
[13] Z. Bradford-Hartke, A. Razmjou, and L. Gregory, “Factors affecting phosphorus recovery as struvite: effects of alternative magnesium sources,” Desalination, vol. 504, p. 114949, 2021.
[14] M. M. T. Zin, M. Hussain, D.-J. Kim, J. E. Yang, Y. J. Choi, and Y.-K. Park, “Circular economy approach: Nutrient recovery and economical struvite production from wastewater sources by using modified biochars,” Chemosphere, vol. 362, p. 142589, Aug. 2024,
[15] Md. M. Rahman, M. A. Mohd. Salleh, U. Rashid, A. Ahsan, M. M. Hossain, and C. S. Ra, “Production of slow release crystal fertilizer from wastewaters through struvite crystallization - A review,” Arab. J. Chem., vol. 7, no. 1, pp. 139-155, Jan. 2014,
[16] S. Polat and P. Sayan, “Application of response surface methodology with a Box-Behnken design for struvite precipitation,” Adv. Powder Technol., vol. 30, no. 10, pp. 2396-2407, Oct. 2019,
[17] Y. Yang, J. Liu, B. Wang, R. Liu, and T. Zhang, “A thermodynamic modeling approach for solubility product from struvite-k,” Comput. Mater. Sci., vol. 157, pp. 51-59, Feb. 2019,
[18] H. Yang, H. J. Sun, and R. T. Downs, “Hazenite, KNaMg2(PO4)2{middle dot}14H2O, a new biologically related phosphate mineral, from Mono Lake, California, U.S.A.,” Am. Mineral., vol. 96, no. 4, pp. 675-681, Apr. 2011,
[19] Y. Yuanquan, Z. Guanhua, G. Jinbo, Q. Dingwen, and L. Runqing, “An insight into the thermal properties of struvite-k by Rietveld refinement method,” J. Mater. Res. Technol., vol. 24, pp. 3683-3690, May 2023,
[20] E. Heraldy, F. Rahmawati, Heriyanto, and D. P. Putra, “Preparation of struvite from desalination waste,” J. Environ. Chem. Eng., vol. 5, no. 2, pp. 1666-1675, Apr. 2017,
[21] R. C. de S. Meira, S. P. A. da Paz, and J. A. M. Corrêa, “XRD-Rietveld analysis as a tool for monitoring struvite analog precipitation from wastewater: P, Mg, N and K recovery for fertilizer production,” J. Mater. Res. Technol., vol. 9, no. 6, pp. 15202-15213, Nov. 2020,
[22] S. Shaddel, S. Ucar, J.-P. Andreassen, and S. W. Østerhus, “Engineering of struvite crystals by regulating supersaturation - Correlation with phosphorus recovery, crystal morphology and process efficiency,” J. Environ. Chem. Eng., vol. 7, no. 1, p. 102918, Feb. 2019,
Cite This Article
  • APA Style

    Rosyidah, A., Meko, F. (2025). Synthesis Hazenite from Bittern as a Source of Magnesium and Sodium. Science Journal of Chemistry, 13(4), 84-101. https://doi.org/10.11648/j.sjc.20251304.11

    Copy | Download

    ACS Style

    Rosyidah, A.; Meko, F. Synthesis Hazenite from Bittern as a Source of Magnesium and Sodium. Sci. J. Chem. 2025, 13(4), 84-101. doi: 10.11648/j.sjc.20251304.11

    Copy | Download

    AMA Style

    Rosyidah A, Meko F. Synthesis Hazenite from Bittern as a Source of Magnesium and Sodium. Sci J Chem. 2025;13(4):84-101. doi: 10.11648/j.sjc.20251304.11

    Copy | Download

  • @article{10.11648/j.sjc.20251304.11,
      author = {Afifah Rosyidah and Flavianus Meko},
      title = {Synthesis Hazenite from Bittern as a Source of Magnesium and Sodium
    },
      journal = {Science Journal of Chemistry},
      volume = {13},
      number = {4},
      pages = {84-101},
      doi = {10.11648/j.sjc.20251304.11},
      url = {https://doi.org/10.11648/j.sjc.20251304.11},
      eprint = {https://article.sciencepublishinggroup.com/pdf/10.11648.j.sjc.20251304.11},
      abstract = {Struvite is a magnesium ammonium phosphate hexahydrate (MAP) crystal with significant potential in agriculture as a slow-release fertilizer. Struvite and its derivatives, such as Hazenite, Struvite-K, and Struvite-Na, can form through specific chemical reactions. Hazenite, a newly discovered mineral in the struvite group, contains two monovalent cations (Na+ and K+) and can be applied in agriculture and orthopedics. Hazenite has an orthorhombic structure with a dipyramidal crystal system and a formula weight of 276.331 g/mol. It was first discovered in Mono Lake, California, and named in honor of Robert M. Hazen. Hazenite forms biologically by microbes that precipitate this crystal when phosphorus levels in the environment increase. The precipitation of struvite and its derivatives requires magnesium, which can be sourced from alternatives like bittern, a byproduct of salt production. This study successfully synthesized Hazenite from bittern as a source of magnesium and sodium. XRD characterization revealed that Hazenite is the dominant phase in the sample, with a tubular elongated shape detected through FESEM-EDX. Using Response Surface Methodology (RSM) with a Box-Behnken Design (BBD), optimal conditions for Hazenite production were identified: pH 11.0 - 11.5, reaction time 45 - 50 minutes, and Mg:Na:PO4 molar ratios of 1:1:1 - 1.2:1.2:1 or 1.8:1.8:1 - 2:2:1. These conditions yielded the highest Hazenite percentage (>95%).},
     year = {2025}
    }
    

    Copy | Download

  • TY  - JOUR
    T1  - Synthesis Hazenite from Bittern as a Source of Magnesium and Sodium
    
    AU  - Afifah Rosyidah
    AU  - Flavianus Meko
    Y1  - 2025/08/04
    PY  - 2025
    N1  - https://doi.org/10.11648/j.sjc.20251304.11
    DO  - 10.11648/j.sjc.20251304.11
    T2  - Science Journal of Chemistry
    JF  - Science Journal of Chemistry
    JO  - Science Journal of Chemistry
    SP  - 84
    EP  - 101
    PB  - Science Publishing Group
    SN  - 2330-099X
    UR  - https://doi.org/10.11648/j.sjc.20251304.11
    AB  - Struvite is a magnesium ammonium phosphate hexahydrate (MAP) crystal with significant potential in agriculture as a slow-release fertilizer. Struvite and its derivatives, such as Hazenite, Struvite-K, and Struvite-Na, can form through specific chemical reactions. Hazenite, a newly discovered mineral in the struvite group, contains two monovalent cations (Na+ and K+) and can be applied in agriculture and orthopedics. Hazenite has an orthorhombic structure with a dipyramidal crystal system and a formula weight of 276.331 g/mol. It was first discovered in Mono Lake, California, and named in honor of Robert M. Hazen. Hazenite forms biologically by microbes that precipitate this crystal when phosphorus levels in the environment increase. The precipitation of struvite and its derivatives requires magnesium, which can be sourced from alternatives like bittern, a byproduct of salt production. This study successfully synthesized Hazenite from bittern as a source of magnesium and sodium. XRD characterization revealed that Hazenite is the dominant phase in the sample, with a tubular elongated shape detected through FESEM-EDX. Using Response Surface Methodology (RSM) with a Box-Behnken Design (BBD), optimal conditions for Hazenite production were identified: pH 11.0 - 11.5, reaction time 45 - 50 minutes, and Mg:Na:PO4 molar ratios of 1:1:1 - 1.2:1.2:1 or 1.8:1.8:1 - 2:2:1. These conditions yielded the highest Hazenite percentage (>95%).
    VL  - 13
    IS  - 4
    ER  - 

    Copy | Download

Author Information
  • Materials and Energy Laboratory, Department of Chemistry, Faculty of Science and Data Analytics, Institut Teknologi Sepuluh Nopember (ITS), Surabaya, Indonesia. Energy and Environment Laboratory, Institut Teknologi Sepuluh Nopember (ITS), Surabaya, Indonesia

  • Materials and Energy Laboratory, Department of Chemistry, Faculty of Science and Data Analytics, Institut Teknologi Sepuluh Nopember (ITS), Surabaya, Indonesia

  • Abstract
  • Keywords
  • Document Sections

    1. 1. Introduction
    2. 2. Experimental
    3. 3. Results and Discussion
    4. 4. Conclusion
    Show Full Outline
  • Abbreviations
  • Acknowledgments
  • Author Contributions
  • Conflicts of Interest
  • References
  • Cite This Article
  • Author Information